Russian Economy: History, Comparisons with Estonia and China
Explore the journey of the Russian economy through history, comparing it with Estonia and China in terms of population, GDP per capita, investment, education, and more. Understand the crucial determinants of growth and key economic indicators shaping these nations.
Download Presentation

Please find below an Image/Link to download the presentation.
The content on the website is provided AS IS for your information and personal use only. It may not be sold, licensed, or shared on other websites without obtaining consent from the author. If you encounter any issues during the download, it is possible that the publisher has removed the file from their server.
You are allowed to download the files provided on this website for personal or commercial use, subject to the condition that they are used lawfully. All files are the property of their respective owners.
The content on the website is provided AS IS for your information and personal use only. It may not be sold, licensed, or shared on other websites without obtaining consent from the author.
E N D
Presentation Transcript
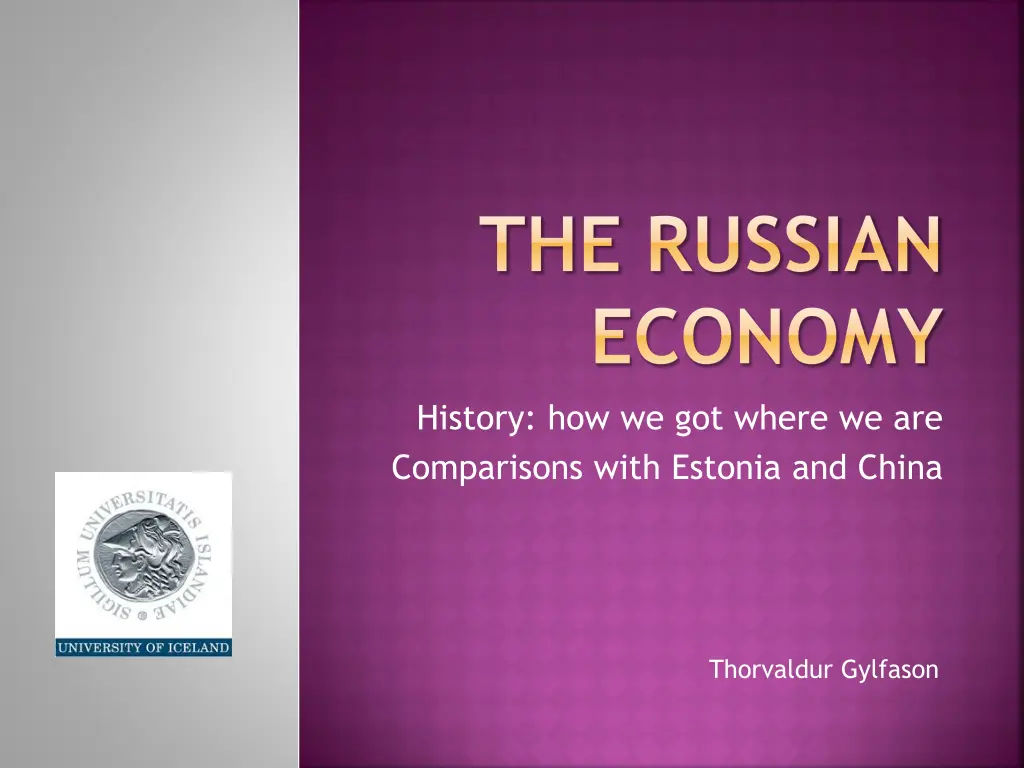
THE RUSSIAN ECONOMY History: how we got where we are Comparisons with Estonia and China Thorvaldur Gylfason
POPULATION 1960-2005 (MILLIONS) 1400 1200 1000 800 Russian Federation 600 China 400 200 0
GROSS DOMESTIC PRODUCT PER CAPITA (PPP, CONSTANT 2000 USD) 16000 Russian Federation 14000 Estonia 12000 China 10000 8000 6000 4000 2000 0 1975 1976 1977 1978 1979 1980 1981 1982 1983 1984 1985 1986 1987 1988 1989 1990 1991 1992 1993 1994 1995 1996 1997 1998 1999 2000 2001 2002 2003 2004 2005
GDP PER CAPITA 1975-2000 (PPP, CONSTANT 2000 USD) 12000 10000 8000 6000 Russian Federation 4000 South Africa 2000 Botswana 0 1977 1986 1975 1976 1978 1979 1980 1981 1982 1983 1984 1985 1987 1988 1989 1990 1991 1992 1993 1994 1995 1996 1997 1998 1999 2000 2001 2002 2003 2004 2005
BEGIN WITH THREE BASIC DETERMINANTS OF GROWTH Growth depends on buildup of physical, human,foreign, and financial capital Investment Education Trade and foreign investment Finance Growth Investment Education Trade Finance
INVESTMENT 1960-2005 (% OF GDP) 50 45 40 35 30 25 20 Russian Federation 15 Estonia 10 China 5 0
FDI 1979-2005 (INWARD FLOWS, % OF GDP) 25 Russian Federation 20 Estonia China 15 10 5 0 1979 2000 1980 1981 1982 1983 1984 1985 1986 1987 1988 1989 1990 1991 1992 1993 1994 1995 1996 1997 1998 1999 2001 2002 2003 2004 2005
SECONDARY-SCHOOL ENROLLMENT 1991-2004 (% OF COHORT) 120 100 80 60 Russian Federation 40 Estonia 20 China 0 1991 1992 1993 1994 1995 1996 1997 1998 1999 2000 2001 2002 2003 2004
EXPENDITURE ON EDUCATION 1991-2003 (% OF GDP) 8 Russian Federation 7 Estonia 6 China 5 4 3 2 1 0 1991 1992 1993 1994 1995 1996 1997 1998 1999 2000 2001 2002 2003
LIFE EXPECTANCY 1960-2005 (YEARS) 80 70 60 50 40 China 30 Russian Federation 20 Estonia 10 0
FERTILITY 1960-2005 (BIRTHS PER WOMAN) 8 Russian Federation 7 Estonia 6 China 5 4 3 2 1 0
EXPORTS 1960-2005 (% OF GDP) 100 90 Russian Federation 80 Estonia 70 China 60 50 40 30 20 10 0
CUSTOMS DUTIES 1990-2004 (% OF IMPORTS) 35 China 30 Russian Federation 25 Estonia 20 15 10 5 0 1990 1991 1992 1993 1994 1995 1996 1997 1998 1999 2000 2001 2002 2003 2004
INFLATION 1961-2005 (% PER YEAR) 1600 Russian Federation 1400 Estonia 1200 China 1000 800 600 400 200 0 -200
INFLATION 1995-2005 (% PER YEAR) 160 140 Russian Federation 120 Estonia 100 China 80 60 40 20 0 1995 1996 1997 1998 1999 2000 2001 2002 2003 2004 2005 -20
ADD FOUR POTENTIALLY IMPORTANT DETERMINANTS OF GROWTH Growth depends on social capital Equality Honesty Democracy and natural capital Oil, minerals Growth Equality Honesty Democracy Oil
MANUFACTURING 1984-2005 (% OF EXPORTS) 100 90 80 70 60 50 40 Russian Federation 30 Estonia 20 China 10 0
INCOME DISTRIBUTION 1998-2004 (GINI INDEX OF INEQUALITY) 50 45 40 35 30 25 20 Russian Federation 15 Estonia 10 China 5 0 1988 1989 1990 1991 1992 1993 1994 1995 1996 1997 1998 1999 2000 2001 2002 2003 2004
CORRUPTION (FROM 1 TO 10) (FROM TRANSPARENCY INTERNATIONAL, 10 MEANS CLEAN) 7 6 5 4 3 2 1 0 Russian Federation Estonia China
CORRUPTION (% OF MANAGERS SURVEYED RANKING THIS AS A MAJOR BUSINESS CONSTRAINT) 30 25 20 15 10 5 0 Russian Federation Estonia China
DEMOCRACY (FROM -10 TO 10) 8 China 6 Estonia 4 Russia 2 0 -2 -4 -6 -8 -10

