Ryan White HIV/AIDS Program 2018 Client Summary Report
"The 2018 Ryan White HIV/AIDS Program Client Summary Report provides detailed data on the types of clients served, including increases in clients diagnosed with AIDS and changes in enrollment status. The report also highlights client demographics such as gender, age, race, ethnicity, and household income, aiding in program decision-making and funding allocation." (Approximately 276 characters)

Download Presentation

Please find below an Image/Link to download the presentation.
The content on the website is provided AS IS for your information and personal use only. It may not be sold, licensed, or shared on other websites without obtaining consent from the author. If you encounter any issues during the download, it is possible that the publisher has removed the file from their server.
You are allowed to download the files provided on this website for personal or commercial use, subject to the condition that they are used lawfully. All files are the property of their respective owners.
The content on the website is provided AS IS for your information and personal use only. It may not be sold, licensed, or shared on other websites without obtaining consent from the author.
E N D
Presentation Transcript
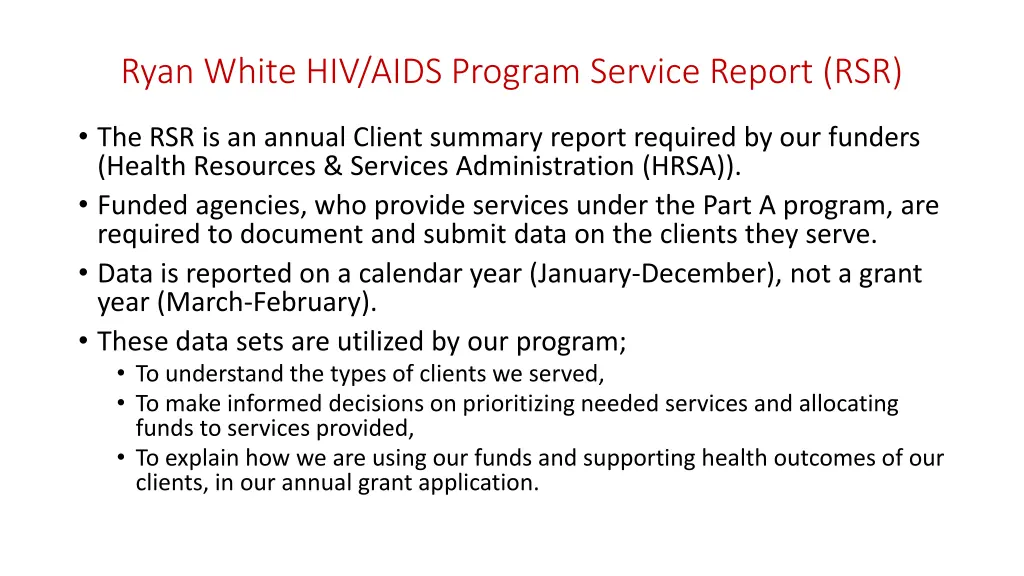
Ryan White HIV/AIDS Program Service Report (RSR) The RSR is an annual Client summary report required by our funders (Health Resources & Services Administration (HRSA)). Funded agencies, who provide services under the Part A program, are required to document and submit data on the clients they serve. Data is reported on a calendar year (January-December), not a grant year (March-February). These data sets are utilized by our program; To understand the types of clients we served, To make informed decisions on prioritizing needed services and allocating funds to services provided, To explain how we are using our funds and supporting health outcomes of our clients, in our annual grant application.
2018 RSR Client Summary Report Data Number of Clients by HIV Status Reported an Increase of 18 clients Number of Clients by HIV/AIDS Status Reported an Increase of 395 diagnosed with AIDS CDC-defined AIDS (<200 CD4 Count) Total # of Unduplicated Clts 2671 3573 2276 # of Clients # of Clients 1270 892 3555 2017 2018 CDC-defined AIDS HIV Positive 2017 2018
2018 RSR Client Summary Report Data cont. Number of Clients by Gender and HIV Status Largest group are Males Number of Clients by Enrollment Status Referred and discharged increased due to data clean up, closing clients that were still designated as active but not receiving services. Enrollment Status Gender Breakdown 27 2165 2160 Removed due to violation of rules 70 2017 2018 9 Relocated 36 1381 1370 # of Clients 2017 53 Referred to another program or discharged 301 2018 20 Deceased 21 17 16 3309 Active Female Male Transgender 3132
2018 RSR Client Summary Report Data cont. Number of Clients by Age and HIV Status Largest group are 45-64 years old; increased by 3 65 years or older increased by 33 Number of Clients by Race, Ethnicity and HIV Status Largest group are Black/African American; decreased by 5 Hispanic total increased by 41 White decreased by 21 Age Breakdown 2017 2018 2017 2018 1983 1980 29 34 603 644 650 671 # of Clients 1076 1054 2254 2249 412 379 110 107 Hispanic Hispanic 4 4 Black or African American Black or African American 2-12 years 13-24 years 24-44 years 45-64 years 65+ years White White Other Other
2018 RSR Client Summary Report Data cont. Number of Clients by Household Income and HIV Status Largest group are Below 100% of the Federal Poverty Level (FPL) Number of clients below 100% FPL decreased by 78 Number of Clients by RSR Housing/Living Arrangement and HIV Status Largest group are Stable/permanent Temporary, Unstable, Unknown Increased by 20 Household Income HRSA Defined Housing Breakdown 2000 1800 3281 3278 1600 1400 1200 # of Clients 1000 # of Clients 800 600 400 200 0 285 Below 100% FPL 100-138% FPL 139-200% FPL 201-250% FPL 251-400% FPL 401-500% FPL More than 500% FPL 265 2017 1869 503 529 282 337 13 11 2018 1791 501 549 314 384 17 5 Stable/permanent Temporary, Unstable, Unknown 2017 2018 2017 2018
2018 RSR Client Summary Report Data cont. Number of Clients and Service Visits by Service Category The 3 top services utilized are NMCM/Eligibility, OAMC, and MCM. The 3 lowest utilized services are HCBHS, Emergency Housing, and EFA. Low utilization of these services could be due to lower supportive funding. Number of Clients by Medical Insurance and HIV Status Largest group are No insurance/uninsured; second largest is Medicaid/ CHIP/other public Service Category Early Intervention Services Home & Community Based Health Services Medical Case Management Medical Nutritional Therapy Mental Health Oral Health Outpatient Ambulatory Medical Care (including Specialty Medical Care and Lab services) # of Clients 519 7 # of Visits 2240 33 Health Insurance for 2018 Only 2111 2190 352 114 816 2279 40,708 594 551 3176 14,486 # of Clients 1161 867 628 Local Pharmacy Assistance Program Non-Medical Case Management Emergency Financial Assistance (including EFA-Prior Authorization) Food Bank (including Nutritional Supplements) Health Insurance Program Housing Medical Transportation Other Professional Services (Legal) 284 3254 85 3119 14,665 134 370 37 6 694 7065 300 31 515 198 2079 93 3688 4419
2018 RSR Clinical Summary Report Data * The Clinical Summary reports on clients who have had a clinical service. Therefore, the numbers from the RSR Client Summary Report and the RSR Clinical Summary Report are different. Number of Clients by Risk Factor Heterosexual contact is the most common risk factor reported, while hemophilia disorder is the least common risk factor reported. Number of New Clinical Clients Decreased by 9. Risk Factors for 2018 Total # of New Clinical Clients 1684 304 # of Clients # of Clients 512 68 50 49 295 43 3 2017 2018
2018 RSR Clinical Summary Report Data cont. Number of Clients by Number of Medical Care Visits The most number of clients had 3-4 visits reported. Number of New Clients Having Viral Load Test During Reporting Period Increased by 15. New Clients having VL Tests Medical Care Visits in 2018 1040 274 925 # of Clients # of Clients 259 167 147 2017 2018 1 Visit 2 Visits 3-4 Visits 5 or More Visits
Minority AIDS Initiative (MAI) MAI formula grants provide core medical and related support services to improve access and reduce disparities in health outcomes in metropolitan areas hardest hit by HIV/AIDS. Our local MAI program is currently only supporting intensive targeted Medical Case Management (MCM) services, which are prioritized for African Americans (including Haitians) and Hispanic/Latino(a) clients that have elevated viral loads. Clients, in these 2 populations, who have complex health issues were enrolled in MAI services. MCM staff work closely with a team of the clients medical providers, to determine the best approach to assist the client in becoming healthier and maintaining better health.
MAI Data MAI MAI Viral Load Suppression Viral Load Suppression Rate GY Comparison Rate GY Comparison MAI MAI HIV Viral Load HIV Viral Load Suppression Rate GY 18 Suppression Rate GY 18- -19 MAI Unduplicated Clients MAI Unduplicated Clients Served GY 18 Served GY 18- -19 19 19 89 All MAI Clients 84 88 87 % Virally Suppressed 87 86 Black/African American Haitian 88 Black/African American Hispanic/Latino(a) Hispanic/Latino(a) 336 Haitian 83 83 616 Hispanic/Latino 87 Haitian Black/African American 83 GY 17-18 GY 18-19 * Haitian clients will count in more than one category on these reports.
HIV/AIDS Bureau (HAB) Health Outcome Measures Recipients should analyze performance measure data to assess quality of care and health disparities and use the performance measure data to inform quality improvement activities. (HRSA PCN #15-02) In our program, the 2 performance measures we focus on for client health outcomes are the HAB measures of Viral Load Suppression and HIV Medical Visit Frequency (Retention in Care) As we collect and analyze these measures, low performance is identified and studied to determine how we can improve the low performance measures. This occurs through the quality improvement (QI) activities.
HAB Performance Measures HAB Performance Measures Definitions Definitions Viral Suppression: Denominator: Number of persons with an HIV diagnosis and who had at least one HIV medical care visit in the 12-month measurement period Numerator: Number of persons with an HIV diagnosis with a viral load < 200 copies/mL at last test in the 12-month measurement period HIV Medical Visit Frequency: Denominator: Number of persons with an HIV diagnosis with at least one HIV/medical care visit in the first 6 months of the 24-month measurement period Numerator: Number of persons with an HIV diagnosis who had at least one HIV medical care visit in each 6 month period of the 24 month measurement period, with a minimum of 60 days between the first medical visit in the prior 6 month period and the last medical visit in the subsequent 6 month period
Service Category Viral Load Suppression % N/D HIV Medical Visit Frequency % N/D 87% 743/854 75% 481/638 AOMC 87% 840/963 72% 544/755 Labs 90% 319/355 79% 226/287 APA (LPAP) GY 18-19 86% 400/466 78% 292/372 Specialty Medical Care 89% 828/930 81% 671/824 Oral Health (3/1/2018 through 2/28/2019) 94% 177/188 88% 133/151 Medical Nutritional Therapy 88% 121/138 66% 119/138 Mental Health 91% 381/418 72% 259/361 Health Insurance Assistance 81% 352/435 56% 126/227 EIS Home & Community Based Health Care 100% 8/8 63% 5/8 84% 1781/2113 70% 1186/1697 MCM 88% 531/606 71% 330/466 NMCM 84% 2483/2968 70% 1640/2346 Eligibility 85% 35/41 71% 22/31 EFA-PA 85% 80/94 64% 48/75 EFA 80% 55/69 68% 43/63 Food- Nutritional Supplements 87% 594/683 80% 487/612 Food Bank 79% 481/605 77% 412/533 Medical Transportation 93% 38/41 65% 17/26 Emergency Housing 85% 232/273 75% 183/241 Legal Services 100% 2/2 100% 2/2 Substance Abuse Residential 84% 2494/2982 69% 1642/2382 All Services All Funded Agencies
Quality Improvement Projects (QIP) Quality improvement involves the development and implementation of activities to make changes to the program in response to the performance data results. To do this, recipients are required to implement quality improvement activities aimed at improving patient care, health outcomes, and patient satisfaction. Once QIPs are created and tested, we are then able to understand if specific changes or improvements had a positive impact on patient health outcomes or if further changes in RWHAP funded services are necessary. Current Projects: Improving HIV Health Outcomes with Data (Case Managed, Non-Suppressed) CQII ECHO Collaborative (Youth 13-24, Non-Suppressed)
Quality Improvement Project Improving HIV Health Outcomes with Data
Quality Improvement Initiative: Improving HIV health outcomes with data Project Objective Develop a quality improvement collaborative to increase the number of People Living with HIV (PLWH) who have suppressed HIV Viral load from 82% to 90% within the measurement period (2019 calendar year). Setting Medical Case Management Sub-recipients receiving Ryan White (RW) Part A funding in Palm Beach County Performance Measure: HIV Viral load Suppression Percentage of patients, regardless of age, with a diagnosis of HIV with a HIV viral load less than 200 copies/ml at last HIV viral load test during the measurement year.
Quality Improvement: Baseline Data HIV Viral Suppression rates during Calendar year 2018 (January December) Baseline data as of December 2018: 162 Non- Virally Suppressed Case Managed(CM) clients 82% Viral Suppression Rate Total Number of CM clients Non-Virally Suppressed Black African American White Asian American Indian Native Hawaiian Haitian Hispanic/Latino Male Female Transgender 162 126 33 3 0 0 35 18 96 65 1
Demographic Profile of non- virally suppressed CM clients Non virally suppressed CM by ethnicity 18 Hispanic/Latino Non virally suppressed CM by race 35 Haitian 140 126 120 0 5 10 15 20 25 30 35 40 100 Haitian Hispanic/Latino 80 60 33 40 Non virally suppressed CM by gender 20 3 0 0 0 Black African American White Asian American Indian Native Hawaiian Transgender 1 Male 96 Female 65 0 50 100 150
Demographic Profile of non- virally suppressed CM clients Non-virally suppressed CM by risk factor Non-virally suppressed CM by housing status 100 0 other # of Clients 141 Stable 14 Unstable 35 11 7 9 Temporary 4 2 1 0 0 Non-permanently housed
Quality Improvement Activities Recipient Provided Medical Case Management (MCM) sub-recipients baseline data(detailed registry). Provided MCM sub-recipients technical assistance to develop their individual quality improvement initiatives Provided MCM sub-recipients 3 month follow-up data, with 89% Viral Suppression rate (after data updates). MCM Sub-recipients Analyze registry data Updated documentation of HIV Viral load and/or active status of clients not achieving viral load Performed a root cause analysis Completed a driver diagram to identify change strategies All MCM sub-recipients will have completed a first quality improvement cycle (test) of selected intervention by July 30th,2019
Quality Improvement Project CQII end+disparities ECHO Collaborative
Quality Improvement Initiative: Youth (13-24) Non-Virally Suppressed Project Overview: The end+disparities ECHO Collaborative is a national initiative to reduce disparities in disproportionately affected HIV subpopulations. Youth (13-24) is the population focus for Palm Bach County participation. The 18-month collaborative aims to increase viral suppression in the Youth HIV subpopulation and increase local quality improvement capacities. The initiate is managed by the HRSA Ryan White HIV//AIDS Program Center for Quality Improvement & Innovation (CQII), developed using the Project Extension for Community Health Outcomes (ECHO) model, and is supported by the HRSA HIV/AIDS Bureau. The end+disparities ECHO Collaborative is about improvement of care for people living with HIV, not performance measurement. However, measurement plays an important role throughout the initiative. Data is submitted every other month, using standardized measurement definitions. Performance Measure: HIV Viral load Suppression Percentage of Youth patients 13-24, with a diagnosis of HIV with a HIV viral load less than 200 copies/ml at last HIV viral load test during the 12-month measurement year.
Definitions: Numerator: Number of persons with an HIV diagnosis with a viral load < 200 copies/mL at last test in the 12-month measurement period Denominator: Number of persons with an HIV diagnosis and who had at least one HIV medical care visit in the 12-month measurement period Key Points: Sub-recipients have been given baseline client level data for their non- suppressed Youth population. Quality Improvement activities are being included in the individual sub- recipients improvement cycles for their overall populations. Specific initiatives will be created and tested, specifically for their Youth populations. Data review and sub-recipients quality improvement projects will be shared during the Quality Management & Evaluation Committee for discussion on Recipient level activities. Limitations: Each reporting period is not reflective of the date reported. The data will not be present day information. Youth populations are constantly in transition. Reporting periods might not include the same data set of clients each time. As the clients age past 24, they are no longer included in the reported data set.
Data Points HIV Viral Suppression (VS) Reporting Periods (determined by Collaborative) September 2018 Reporting period: 7/1/2017 through 6/30/2018 November 2018 Reporting Period: 9/1/2017 through 8/30/2018 January 2019 Reporting Period: 11/1/2017 through 10/31/2018 March 2019 Reporting Period: 1/1/2018 through 12/31/2018 Den: Sept Num: Sept VS% Sept Den: Nov Num: Nov VS% Nov Den: Jan Num: Jan VS% Jan Den: March Num: March VS% March Totals 2733 2281 83% 2717 2299 85% 2755 2368 86% 2860 2406 84% Youth (13-24) 52 44 85% 54 43 80% 49 42 86% 56 41 73%
Viral Suppression Rates (VS) 90 85.95 85.71 84.62 84.62 84.13 85 83.46 79.63 80 75 73.21 70 65 Baseline 2nd Reporting 3rd Reporting 4th Reporting Total Youth In September 2018, there was a baseline Total VS rate of 83.5% reported and Youth VS rate of 85%. At last reporting period, there was a .67% increase in Total VS and 11.41% decrease in Youth VS. The local overall goal of the quality improvement project is to reach 90% VS rate for both the Total clients and Youth subpopulation. This would result in an increase of a 4% VS rate across the board.
")


")

 Health Outcome Measures")


")


")


")