Salary Proposal Comparison in Community College Economics
Comparison of salary proposals for faculty members in Column F and Ph.D. holders in a Community College Economics setting, analyzing the effects of proposals from the District and AFT over a three-year contract.

Download Presentation

Please find below an Image/Link to download the presentation.
The content on the website is provided AS IS for your information and personal use only. It may not be sold, licensed, or shared on other websites without obtaining consent from the author.If you encounter any issues during the download, it is possible that the publisher has removed the file from their server.
You are allowed to download the files provided on this website for personal or commercial use, subject to the condition that they are used lawfully. All files are the property of their respective owners.
The content on the website is provided AS IS for your information and personal use only. It may not be sold, licensed, or shared on other websites without obtaining consent from the author.
E N D
Presentation Transcript
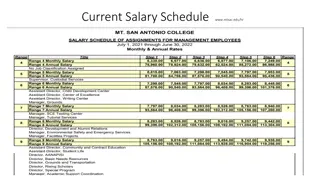
Exhibit M in the first binder presents a comparison of the effects of the Salary proposal from the District with the salary proposal from the AFT. That exhibit compares the results for just two salary schedule cells: a faculty member in column F, the lowest column requiring an MA and Column G, the column requiring a Ph.D.
Figure 1 Comparison of AFT and District salary proposals for Column F, step 16 4.0% 2.0% AFT Percentage difference from Bay 10 median Relative to Bay 10 Ave 0.0% Now Year 1 Year 2 Year 3 -2.0% -4.0% -6.0% -8.0% District -10.0% -12.0% -14.0% -16.0% The CCSF Column F, step 16 salary is currently 13.6% below the median for the other nine community college districts in the Bay 10. Under the District s proposal, in year two, they would still be 5.4% below the median and in three years, they would still be 9.4% below that median. Under the AFT proposal, this faculty member would still be 2.3% below the Bay 10 median in year 2, and would be only 1.6% above that median in year three of the contract.
Figure 2 Comparison of AFT and District salary proposals for Ph.D., step 16 Relative to Bay 10 median Year 3 0.0% Now Year 1 Year 2 -2.0% Percentage difference from Bay 10 median -4.0% AFT -6.0% -8.0% -10.0% -12.0% -14.0% District -16.0% -18.0% -20.0% The CCSF Ph.D. step 16 faculty are currently paid $20,800 less each year than the median of comparable instructors at the other nine Bay Area community college districts, which is currently 18.3% below the median. Under the District s proposal, in three years, this salary would still be 14.4% below that median. Under the AFT proposal, this faculty member would not reach the Bay 10 median, and would still be 4.7% below that median in year three of the contract.
Exhibit M only discusses the previous two salary schedule cells in detail. For completeness, the comparison of the three remaining columns are presented here. Figure 2b Comparison of AFT and District salary proposals for F+15, step 16 4.0% AFT 2.0% Percentage difference from Bay 10 median Relative to Bay 10 median Year 3 0.0% Now Year 1 Year 2 -2.0% -4.0% -6.0% -8.0% District -10.0% -12.0% -14.0% The CCSF Column F+15, step 16 salary is currently 12.5% below the median for the other nine community college districts in the Bay 10. Under the District s proposal, in year two, they would still be 3.9% below the median and in three years, they would still be 7.4% below that median. Under the AFT proposal, this faculty member would be 1.0% below the Bay 10 median in year 2, and would be 2.9% above that median in year three of the contract.
Figure 2c Comparison of AFT and District salary proposals for F+30, step 16 Comparison of AFT and District salary proposals for F+30, step 16 4.0% 2.0% AFT AFT Percentage difference from Bay 10 median Percentage difference from Bay 10 median Relative to Bay 10 median Year 3 Relative to Bay 10 median 0.0% Now Year 1 Year 2 -2.0% -4.0% -6.0% -8.0% District District -10.0% -12.0% -14.0% -16.0% The CCSF Column F+30, step 16 salary is currently 13.8% below the median for the other nine community college districts in the Bay 10. Under the District s proposal, in year two, they would still be 5.5% below the median and in three years, they would still be 9.6% below that median. Under the AFT proposal, this faculty member would be 2.5% below the Bay 10 median in year 2, and would be 1.4% above that median in year three of the contract.
Figure 2d Comparison of AFT and District salary proposals for F+45, step 16 Comparison of AFT and District salary proposals for F+45, step 16 Relative to Bay 10 Relative to Bay 10 0.0% Now Year 1 Year 2 Year 3 Percentage difference from Bay 10 average Percentage difference from Bay 10 average AFT AFT -2.0% -4.0% -6.0% -8.0% -10.0% District District -12.0% -14.0% -16.0% The CCSF Column F+45, step 16 salary is currently 15.1% below the median for the other nine community college districts in the Bay 10. Under the District s proposal, in year two, they would still be7.0% below the median and in three years, they would still be 10.9% below that median. Under the AFT proposal, this faculty member would be 4.0% below the Bay 10 median in year 2, and would be 0.2% below that median in year three of the contract.
Figure 3 provides detail on all of the salary steps and columns. Amount by which CCSF Full time faculty salaries are below the Bay 10 median salary Step Amount by which CCSF Full time faculty salaries are below the Bay 10 median salary Column Step Column Column F +15 Column Column F F Column F +15 Column F +30 Column F +30 Column F +45 Column F +45 Column G Column G - - PhD E E PhD 1 2 3 4 5 6 7 8 9 10 11 12 13 14 15 16 17 18 19 20 21 22 23 24 25 26 27 28 29 30 -$5,360 -$4,110 -$3,950 -$3,970 -$4,010 -$4,170 -$4,490 -$4,860 -$5,220 -$5,580 -$6,430 -$5,430 -$4,440 -$3,510 -$2,320 -$1,140 -$1,140 -$1,180 -$2,130 -$3,070 -$4,350 -$5,560 -$6,770 -$7,590 -$8,310 -$8,310 -$8,310 -$8,310 -$8,310 -$8,310 -$6,200 -$6,410 -$6,650 -$6,750 -$6,850 -$6,950 -$7,050 -$7,150 -$7,250 -$7,010 -$6,550 -$7,170 -$5,890 -$4,600 -$3,320 -$2,080 -$2,840 -$2,840 -$2,840 -$3,720 -$4,930 -$6,140 -$7,350 -$8,560 -$9,770 -$9,770 -$9,770 -$9,770 -$9,770 -$9,770 -$5,320 -$5,420 -$5,460 -$5,570 -$5,660 -$5,760 -$5,860 -$6,040 -$6,420 -$6,740 -$7,070 -$7,440 -$6,360 -$5,080 -$3,800 -$2,520 -$3,270 -$3,270 -$3,270 -$3,270 -$4,490 -$4,950 -$6,160 -$8,990 -$10,200 -$10,200 -$11,890 -$11,890 -$11,890 -$11,890 -$7,300 -$7,290 -$7,530 -$7,760 -$7,910 -$8,060 -$8,210 -$8,360 -$8,510 -$8,670 -$9,040 -$9,400 -$9,230 -$8,740 -$7,510 -$6,280 -$7,050 -$8,240 -$8,240 -$8,240 -$8,470 -$9,340 -$9,870 -$11,090 -$12,300 -$12,300 -$14,050 -$14,050 -$14,050 -$14,050 -$7,430 -$6,270 -$6,350 -$6,720 -$7,080 -$7,440 -$7,820 -$8,130 -$8,470 -$8,840 -$9,200 -$9,530 -$9,860 -$8,330 -$6,320 -$5,090 -$6,230 -$7,400 -$8,150 -$8,150 -$9,100 -$9,670 -$10,740 -$12,240 -$13,620 -$13,620 -$15,930 -$15,930 -$15,930 -$15,930 -$10,310 -$10,160 -$10,290 -$10,500 -$10,700 -$10,900 -$11,110 -$11,310 -$11,510 -$11,720 -$11,920 -$12,120 -$12,400 -$12,530 -$11,400 -$10,230 -$11,170 -$11,170 -$11,170 -$12,550 -$12,660 -$13,450 -$14,220 -$15,430 -$18,030 -$18,030 -$18,030 -$18,770 -$18,770 -$20,160
Summary of Figure 3 Step Column E Column F Column F +15 Column F +30 Column F +45 Column G - PhD Average shortfall: -$5,020 Percent of faculty: Number of salary cells with shortfall of: -$2,000 to -$5,000 -$5,001 to -$10,000 -$10,001 to -$15,000 more than -$15,000 -$6,520 -$6,540 -$9,370 -$9,520 -$13,100* 5.0% 18.0% 18.8% 14.4% 8.5% 35.5% 16 103 46 15 The column with the largest shortfall is column G. This column also includes the largest percentage of faculty at CCSF, 35.5%. This single cell with the largest shortfall, Column G, step 16, has the highest percentage of the faculty than any other single cell, 3.3%. *Note: this row reflects the correct values, which are different than those shown in Exhibit M.
Large tables of data seldom convey as much meaning as a visual comparison. This chart compares all 180 salary schedule cells at CCSF with those of the Bay 10. CCSF to Bay 10 Full-Time Salary Comparison 2015/16 100 90 (Number of Salary Cells) 80 70 Frequency 60 50 40 30 20 10 0 1 2 3 4 5 6 7 8 9 10 Rank The stated goal of every contract since 1999 has been to keep CCSF faculty salaries above the median of the Bay 10 , which are the 10 community college districts in the SF metropolitan area. This chart shows the current number of salary schedule cells at CCSF in each rank of the Bay 10 colleges. For example, 88 CCSF salary cells are ranked 9th out of 10 and 57 salary cells are ranked last. Currently, 100% of salary schedule column and row cells are below the Bay 10 median for the corresponding cell.
Distribution of salary schedule cells under the District proposal. CCSF to Bay 10 Full-Time Salary Comparison District Proposal 60 (Number of Salary Cells) 50 40 Frequency 30 20 10 0 1 2 3 4 5 6 7 8 9 10 Rank Under the administration s proposal, 93% of salary schedule cells would still be below the Bay 10 median at the end of the three year contract. This is assuming that none of the other Bay 10 colleges give any salary increases during the next three years.
Distribution of salary schedule cells under the AFT proposal. CCSF to Bay 10 Full-Time Salary Comparison AFT Proposal 70 (Number of Salary Cells) 60 50 Frequency 40 30 20 10 0 1 2 3 4 5 6 7 8 9 10 Rank Under the AFT proposal, 94% of the salary schedule cells would meet the historical target of being at or above the Bay 10 median. All of the 6% of salary schedule cells that are still below the Bay 10 median are for faculty with a Ph.D. and more than 12 years of teaching experience. The 4% of salary schedule cells that are ranked number one are for instructors in disciplines that require only a BA.
Comparing current CCSF salaries to state-wide salaries The stated goal of every contract since 1999 has been to keep CCSF faculty salaries above the median of the Bay 10 , which are the 10 community college districts in the SF metropolitan area. The previous pages demonstrate that this goal is not being met. The situation appears even worse when we compare salaries at CCSF with community college throughout the state. The All Faculty Association at Santa Rosa Community College compiles the salary schedules of all 72 community colleges in the state of California every year. They publish a comparison of these schedules in an annual report. They focus on the highest non-doctorate salary column for each college. San Francisco has the highest cost of living of any region in the state, yet based on this study, the highest possible salary for this column at CCSF ranks 68th out 72 colleges. The only four colleges with lower maximum salaries than CCSF are in rural areas, with much lower costs of living. The state Chancellor s office also provides a comparison of faculty salaries. The reported salaries are not broken down by salary columns. Only the average salary for tenured and tenure-track faculty is given for each college. Based on this data, salaries at CCSF rank 65th out of the 72 community colleges
Implications Resignations The number of full-time faculty reached a high point in the Fall 2011. Since that time, the number of full-time faculty has fallen by 176, which is a decline of 21.4% in just four years. The majority of the faculty who have left have been retirees, but at least 34 (19.3%) faculty members resigned in order to take positions at other institutions. Retirements Full-time, instructional, 62 or older, by column E F f+15 f+30 10 25 42 23 f+45 17 G 77 This table shows there are a large number of faculty who are very close to retirement. Many of them have delayed their retirement because stagnant salaries have greatly reduced their potential retirement income. If their salaries are increased, as the AFT proposes, many of them are likely to retire in two to three years. This has a major implication relative to the potential loss of stability funding.