Sales Forecast Presentation for Your Company
"This presentation provides a detailed overview of sales forecasts, projected sales growth, and quarterly sales. It includes charts linked to Excel for automatic updates, along with key information for customization. Disclaimer: Information provided is for reference; reliance is at your own risk."

Download Presentation

Please find below an Image/Link to download the presentation.
The content on the website is provided AS IS for your information and personal use only. It may not be sold, licensed, or shared on other websites without obtaining consent from the author.If you encounter any issues during the download, it is possible that the publisher has removed the file from their server.
You are allowed to download the files provided on this website for personal or commercial use, subject to the condition that they are used lawfully. All files are the property of their respective owners.
The content on the website is provided AS IS for your information and personal use only. It may not be sold, licensed, or shared on other websites without obtaining consent from the author.
E N D
Presentation Transcript
SALES FORECAST PRODUCT / TEAM / DEPT YOUR LOGO COMPANY NAME 00/00/0000 [PRESENTER NAME] [PRESENTER NAME] [PRESENTER NAME] SALES FORECAST
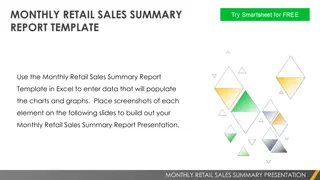
*Insert a chart that links to an Excel spreadsheet so changes update automatically based on data input. OVERVIEW
PROJECTED SALES GROWTH Your Subtitle Here 75 % 60 % 30 % 95 % TEXT TEXT TEXT TEXT Click the colored line above, then drag the yellow square to adjust the circle according to the percentage. Click the colored line above, then drag the yellow square to adjust the circle according to the percentage. Click the colored line above, then drag the yellow square to adjust the circle according to the percentage. Click the colored line above, then drag the yellow square to adjust the circle according to the percentage. PROJECTED SALES GROWTH
PROJECTED QUARTERLY SALES Your Subtitle Here 00% 00 % 00 % 00 % Q1 Q2 Q3 Q4 Click the colored area above, then drag the yellow square to adjust the area filled according to the percentage. Click the colored area above, then drag the yellow square to adjust the area filled according to the percentage. Click the colored area above, then drag the yellow square to adjust the area filled according to the percentage. Click the colored area above, then drag the yellow square to adjust the area filled according to the percentage. PROJECTED QUARTERLY SALES
SAMPLE TEXT: o Click the icons on this slide to customize them. o Right-click this slide to format the background color. o Use this slide to present key information.
DISCLAIMER Any articles, templates, or information provided by Smartsheet on the website are for reference only. While we strive to keep the information up to date and correct, we make no representations or warranties of any kind, express or implied, about the completeness, accuracy, reliability, suitability, or availability with respect to the website or the information, articles, templates, or related graphics contained on the website. Any reliance you place on such information is therefore strictly at your own risk.