Sales Forecasting Techniques for Business Decisions
Learn how managers make decisions on a day-to-day, medium-term, and longer-term basis. Explore the importance of sales forecasting in informing resource management, cash flows, budgets, and workforce planning. Discover quantitative sales forecasting techniques such as time-series analysis, moving averages, and trend interpretation for predicting future sales levels.

Download Presentation

Please find below an Image/Link to download the presentation.
The content on the website is provided AS IS for your information and personal use only. It may not be sold, licensed, or shared on other websites without obtaining consent from the author. If you encounter any issues during the download, it is possible that the publisher has removed the file from their server.
You are allowed to download the files provided on this website for personal or commercial use, subject to the condition that they are used lawfully. All files are the property of their respective owners.
The content on the website is provided AS IS for your information and personal use only. It may not be sold, licensed, or shared on other websites without obtaining consent from the author.
E N D
Presentation Transcript
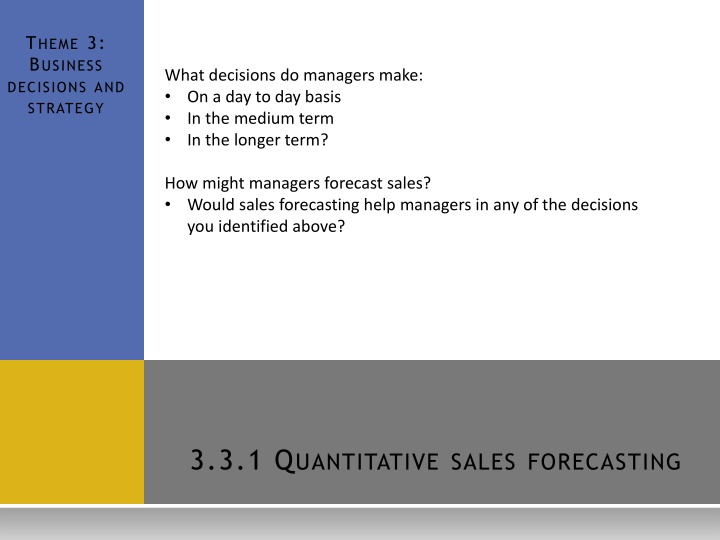
THEME 3: BUSINESS DECISIONSAND STRATEGY What decisions do managers make: On a day to day basis In the medium term In the longer term? How might managers forecast sales? Would sales forecasting help managers in any of the decisions you identified above? 3.3.1 QUANTITATIVE SALES FORECASTING
3.3.1 QUANTITATIVESALESFORECASTING In this topic you will learn about Calculation of time-series analysis: moving averages (three period/four quarter) interpretation of scatter graphs and line of best fit extrapolation of past data to future limitations of quantitative sales forecasting techniques
SALESFORECASTING Sales forecasting is the process of predicting future sales levels by volume or value and future trends Quantitative sales forecasting is based on data which can be historic or the result of quantitative research How can big data help sales forecasting at M&S bakeries? Sales forecasting will be used to: Inform resource management about inventory levels, production output and logistics Inform cash flows and budgets Aid workforce planning
TIME-SERIESANALYSIS Time-series analysis shows past sales figures in date order Before looking at how to calculate moving averages first check your understanding of averages. Marketers use this historical data, after fluctuations have been smoothed out, to identify trends Trends are then used to predict future sales Sales in m for 6 months are 2, 2.5, 3, 3, 1.5 and 4. Moving averages Shows whether a trend is significant by smoothing out fluctuations in data The average is 2.67m. Allows for better identification of an overall trend Add all the numbers up and divide by 6. Identifies influencing factors on future sales e.g. seasonal, cyclical or random fluctuations Sufficient data is needed to give validity to the trend identified
CALCULATINGMOVINGAVERAGES Month Sales m 3 period moving average Jan 10 Feb 14 12 10+14+12 = 36 36/3 = 12 Mar 12 11.67 Apr 9 10.67 May 11 14+12+9 = 38 35/3 = 11.67 June 13 July 12 Show how this figure was calculated August 11 Calculate the next two moving averages. Plot a graph to show both the quarter figures and the moving average figures.
CALCULATINGMOVINGAVERAGES A 4 quarter moving average helps to smooth out seasonal variations to show a more reliable trend. Year / Quarter Sales m 4 quarter moving average 2015/Q1 10 10+14+12+9 = 45 45/4 = 11.25 Note the answer is centred. 2015/Q2 14 11.25 2015/Q3 12 2015/Q4 9 2016/Q1 11 2016/Q2 13 2016/Q3 12 2016/Q4 11 Complete the table. Plot a graph to show both the quarter figures and the moving average figures.
INTERPRETATIONOFSCATTERGRAPHS Scatter graphs plot the relationship between 2 variables to identify correlation Correlation is the identifying of a relationship between 2 variables E.g. marketing budget and sales Correlation can be: Positive the 2 variables move in the same direction e.g. as temperature goes up ice cream sales go up Negative the 2 variables move in opposite directions e.g. as road tax prices go up the sales of new 4 x 4s goes down Zero there is no relationship between the factors e.g. average rain fall and sales of text books
CORRELATION -1 0 +1 Strong negative Zero Strong positive The strength of correlation can be expressed on a spectrum from -1 to +1 It can also be shown on a graph by plotting the coordinates and then drawing a line of best fit Draw a scatter graph and line of best fit to show a positive correlation. X Negative X X X X X X X X X X X X X X
INPAIRS -1 0 +1 Strong negative Zero Strong positive Plot each of the following combinations of variables on the spectrum above. Be prepared to justify your decision Price of Coca Cola and sales of Tesco own brand cola a. Advertising expenditure by Toyota and sales of the Toyota Prius b. The launch of a new iPhone and profit margins at SuperDry c. Fuel prices and price of used cars d.
TESTYOURSELF What is the most likely correlation between an increase in the selling price of a games console and the sales volume of the games that go with it? +1.7 a) +0.4 b) -1.7 c) -0.4 d) Justify your answer.
EXTRAPOLATION Using past data to extend an identified trend into the future A general slow upward trend has been identified and from this yr 6 and 7 have been extrapolated
EXTRAPOLATION A useful technique when trends can clearly be identified and The market is relatively stable However The past is not always a good indication of the future Conditions and trends can soon change Competitors actions Consumer tastes Market conditions
LIMITATIONSOFQUANTITATIVESALES FORECASTINGTECHNIQUES For each external factor identify how this might affect the accuracy of sales forecasts for a children s pre school nursery. PESTLE The further into the future the greater the uncertainty Sales will be influenced by external influences which are difficult to accurately predict The past is not always a fair indication of the future May be manipulated or biased Inadequate market research Unexpected events Why has the Brexit vote made sales forecasting more difficult?
3.3.1 QUANTITATIVESALESFORECASTING In this topic you have learnt about Calculation of time-series analysis: moving averages (three period/four quarter) interpretation of scatter graphs and line of best fit extrapolation of past data to future limitations of quantitative sales forecasting techniques