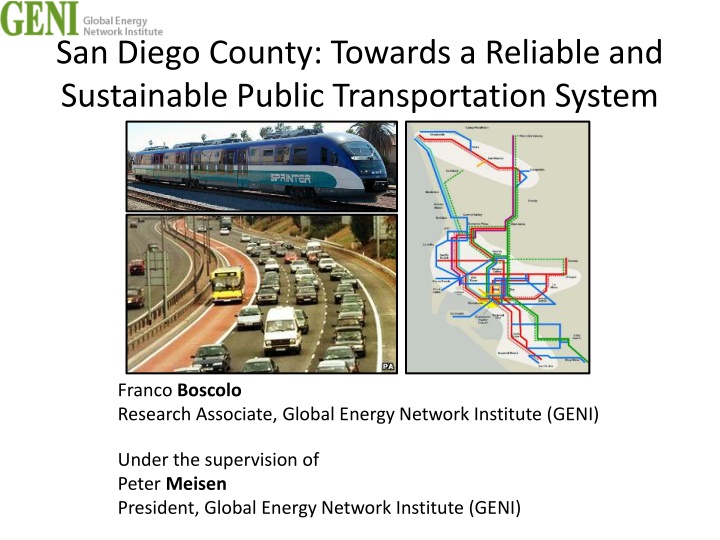
San Diego County: Towards a Reliable and Sustainable Public Transportation System
Franco Boscolo, a Research Associate at the Global Energy Network Institute, discusses fleet information, population trends, and suggestions for a more reliable and sustainable public transportation system in San Diego County. The research includes data on commuting modes, daily vehicle miles traveled, transit ridership by city, and population, jobs, and housing growth projections. Proposals for a more reliable system and comparisons of mode performance perceptions are also presented.

Uploaded on Mar 12, 2025 | 2 Views
Download Presentation

Please find below an Image/Link to download the presentation.
The content on the website is provided AS IS for your information and personal use only. It may not be sold, licensed, or shared on other websites without obtaining consent from the author.If you encounter any issues during the download, it is possible that the publisher has removed the file from their server.
You are allowed to download the files provided on this website for personal or commercial use, subject to the condition that they are used lawfully. All files are the property of their respective owners.
The content on the website is provided AS IS for your information and personal use only. It may not be sold, licensed, or shared on other websites without obtaining consent from the author.
E N D
Presentation Transcript
San Diego County: Towards a Reliable and Sustainable Public Transportation System Franco Boscolo Research Associate, Global Energy Network Institute (GENI) Under the supervision of Peter Meisen President, Global Energy Network Institute (GENI)
Summary Fleet information Population trends Suggestion for a more reliable system Suggestion for a more sustainable system
Fleet information MTS Bus Trolley NCTD BREEZE COASTER SPRINTER Amtrak Pacific Surfliner
Population trends Modes of commuting to work (2010) Driving Alone Carpooling 76% Work at home Public Transits 2% 3% Walking 3% 6% Other 10%
Population trends Daily Vehicle Miles Travelled (VMT) per capita 16 miles 14 12 2009 10 2010 8 6 4 2 0 San Francisco Los Angeles Orange County San Diego CALIFORNIA
Population trends Daily Vehicle Miles Travelled (VMT) 70 Millions of miles 60 50 40 30 20 10 0 1983 1985 1987 1989 1991 1993 1995 1997 1999 2001 2003 2005 2007
Population trends Transit ridership by city 600 Millions of ridership 500 400 300 200 100 0 New York City Chicago San Francisco Los Angeles Washington San Diego
Population trends Population, jobs and housing growth 5.0 Millions of people 4.5 4.0 3.5 3.0 2.5 2.0 1.5 1.0 0.5 0.0 2000 2010 2020 2030 2040 2050 2060 Population Jobs Housing
Proposal: reliable system Comparison of perception of mode performance Source: SANDAG 2008, San Diego Region Public Transit Opinion Study, Encinitas, True North Research.
Proposal: reliable system Motivations for not using transits No travels to necessary areas 13.9 10.8 Stops locations are inconvenient General inconvenience of transit 15.0 Takes too long 9.8 No transit options near home Schedule inconvenient 8.5 Prefer other modes Too expensive 20.2 8.0 Do not need / Rarely travel 5.1 Other 4.5 4.2
Proposal: reliable system 2050 regional development plan Area improvement Transit development Fast connections Source: SANDAG 2011, 2050 Regional Transportation Plan Our region, Our Future, San Diego.
Proposal: reliable system Bus lanes and automatic light systems seconds 0 10 20 30 40 50 Toll lanes on 12th & Imperial 12th & Petco Pk. 12th & K Park & J Park & Island Park & Market Park & G Park & F Park & E Park & Brodway C & 11th C & 10th highways Bus lanes on city centres Active signal C & 9th C & 8th C & 7th C & 6th C & 5th C & 4th C & 3rd C & 2nd C & First C & Front C & India Average priority system
Proposal: reliable system More transit options Higher transit frequency Source: TfL (Transport for London) 2012a, Timetable of Bus 159 towards Paddington Basin (W2), Accessed on 15 August 2012, <http://www.tfl.gov.uk/>.
Proposal: reliable system GPS-tracked transits: Online and mobile Apps: Source: Apple Inc. UK 2012, iTunes Preview App Store > Navigation, Accessed on 15 August 2012, <http://itunes.apple.com/gb/genre/ios-navigation/id6010?mt=8&letter=L&page=3#page>.
Proposal: sustainable system Diesel vs. Compressed Natural Gas (CNG) 18 g/km 16 14 12 10 8 6 4 2 0 CO NOx PM Euro3 Diesel Early CNG Reduction: 25.45% 28.45% 98.12%
Proposal: sustainable system Diesel vs. Compressed Natural Gas (CNG) When both engine types are retrofitted with cleaning technologies, reductions decrease Emissions (gCO2eq/km) Source Diesel CNG Reduction Beer et al. 2001 1,759 1,604 8.81% Sliva et al. 2006 2,277 2,070 9.09% Costs do not justify CNG choice: CNG ($) Clean Diesel ($) Per Bus - - - 1,040 - 137 670 Cost Details Per Bus 2,860 - 5,200 - - - - Per Fleet 0.6 x 10⁶ 0.9 x 10⁶ 1.0 x 10⁶ - - - - 2,500,000 Per Fleet - - - 208,000 92,000 27,400 134,000 461,400 Incremental CNG Fuel CNG Fuel Station Maintenance Incremental Bus Maintenance Incremental Cleaning Technology Diesel Fuel Station Maintenance Clean Technology Replacement Annual Technology Cleaning TOTAL Source: DEER (Directions in Engine-Efficiency and Emissions Research) 2003, Comparison of Clean Diesel Buses to CNG Buses, New York City Transit Department of Buses, from August 26, 2003 DEER Conference, Newport, RI.
Proposal: sustainable system Electrification of the railway system Rail and light-rail services powered by Diesel engines: Service Company Travel (mi) Weekly Trips Yearly Travel (mi) Coaster NCTD 41 46 98,072 Sprinter NCTD 22 132 151,008 Pacific Surfliner Amtrak 63 154 504,504 Total 753,584 Electrification has the benefits of: - Reducing environmental impacts - Improving the reliability of the service - Increasing the capacity of trains - Reducing maintenance, fuel and wear and tear costs
Proposal: sustainable system CO2reduction by electrification: 20% - 35% (no local) Diesel Electric 0 500 1,000 1,500 2,000 CO2 Emissions (g/mi) 2,500 Reliability improvement by electrification: 29% - 57% Regional Diesel Intercity Electric 0 5,000 10,000 15,000 20,000 25,000 30,000 Distance (miles) 35,000 Reduced operating costs (35%) and leasing costs (20%)
Proposal: sustainable system Regenerative braking system
Proposal: sustainable system Cycling and walking Bike Path Type Miles % 159.3 11.9 Bike Lane 890.2 66.4 Current San Diego availability Bike Route 243.9 18.2 Freeway Shoulders 47.4 3.5 Total 1340.8 100 Development of more bike and pedestrian paths Development of a bike docking station system


![(❤Read⚡) [✔PDF✔] The Best Travel Guide - San Diego: A Cicerone’s View of To](/thumb/68088/read-pdf-the-best-travel-guide-san-diego-a-cicerone-s-view-of-to.jpg)