Santa Ana Unified School District 2024-2025 Budget Overview
Explore the Santa Ana Unified School District's 2024-2025 budget details, including financial projections, certifications, and budget timeline. Learn about the district's financial status and outlook for the upcoming fiscal years.

Download Presentation

Please find below an Image/Link to download the presentation.
The content on the website is provided AS IS for your information and personal use only. It may not be sold, licensed, or shared on other websites without obtaining consent from the author. If you encounter any issues during the download, it is possible that the publisher has removed the file from their server.
You are allowed to download the files provided on this website for personal or commercial use, subject to the condition that they are used lawfully. All files are the property of their respective owners.
The content on the website is provided AS IS for your information and personal use only. It may not be sold, licensed, or shared on other websites without obtaining consent from the author.
E N D
Presentation Transcript
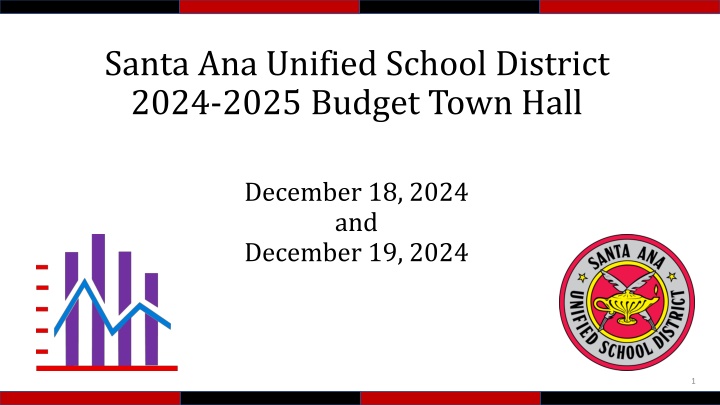
Santa Ana Unified School District 2024-2025 Budget Town Hall December 18, 2024 and December 19, 2024 1
Budget Timeline Adopted LCAP & Budget 2024-2025 Fiscal Year Second Interim Period Unaudited Actuals Estimated Actuals First Interim Period 2024-2025 Budget Year Second Interim External Audit 2023-2024 External Audit First Interim JAN JUN JUL AUG SEP OCT NOV DEC FEB MAR APR MAY JUN JUL AUG SEP OCT NOV DEC 2023 2024 2025-2026 Budget Year JUN JUL AUG SEP OCT NOV DEC JAN FEB MAR APR MAY JUN JUL AUG SEP OCT NOV DEC Governor's Budget May Revision LCAP & Budget Hearings Adopted LCAP & Budget LCAP and Budget Development 2
Budget Timeline Adopted LCAP & Budget 2024-2025 Fiscal Year Second Interim Period Unaudited Actuals Estimated Actuals First Interim Period 2024-2025 Budget Year Second Interim External Audit 2023-2024 External Audit First Interim JAN JUN JUL AUG SEP OCT NOV DEC FEB MAR APR MAY JUN JUL AUG SEP OCT NOV DEC 2023 2024 2025-2026 Budget Year JUN JUL AUG SEP OCT NOV DEC JAN FEB MAR APR MAY JUN JUL AUG SEP OCT NOV DEC Governor's Budget May Revision LCAP & Budget Hearings Adopted LCAP & Budget LCAP and Budget Development 3
Positive Certification o The District WILL meet its financial obligations for the current and two subsequent fiscal years. Qualified Certification o The District MAY NOT meet its financial obligations for the current or two subsequent fiscal years. Negative Certification o The District WILL BE UNABLE to meet its financial obligations for the remainder of the current year or for the subsequent fiscal year. 4
Positive Certification o The District WILL meet its financial obligations for the current and two subsequent fiscal years. Qualified Certification o The District MAY NOT meet its financial obligations for the current or two subsequent fiscal years. Negative Certification o The District WILL BE UNABLE to meet its financial obligations for the remainder of the current year or for the subsequent fiscal year. 5
$450,000,000 Actuals Projections $418,263,344 $400,000,000 $350,000,000 $362,505,163 $300,000,000 $275,590,708 $250,000,000 $175,168,263 $200,000,000 $189,796,393 $135,014,632 $150,000,000 $167,795,098 $157,437,036 $130,910,923 $100,000,000 $105,947,581 $50,000,000 $0 6
$450,000,000 $418,263,344 $400,000,000 $362,505,163 $350,000,000 $194,246,359 $300,000,000 $170,366,336 $250,000,000 $200,000,000 $175,168,263 $167,795,098 $157,437,036 $150,000,000 $106,247,696 $224,016,986 $100,000,000 $121,526,560 $192,138,827 $150,397,788 $50,000,000 $68,920,568 $35,910,476 $17,397,310 $0 2022-2023 2023-2024 2024-2025 2025-2026 2026-2027 Unrestricted EFB Restricted EFB 7
Assumptions for COLA Official Cost of Living Adjustment (COLA) Legislative Analyst's Office COLA Increase/Decrease 2024-2025 2025-2026 2026-2027 1.07% 1.07% 0.00% 2.93% 2.46% -0.47% 3.08% 3.80% 0.72% Assumptions for Enrollment Enrollment at Adopted Budget Enrollment at First Interim (Includes ALA) Increase/Decrease 2024-2025 2025-2026 2026-2027 36,318 36,068 -250 34,741 34,484 -257 33,114 32,850 -264 Assumptions for UPP Unduplicated Pupil Percentage (UPP) at Adopted Budget UPP at First Interim Increase/Decrease 2024-2025 2025-2026 2026-2027 89.45% 82.21% -7.24% 91.44% 89.00% -2.44% 92.88% 91.00% -1.88% 8
60,000 Source: CDE DataQuest Includes ALA 53,388 52,623 51,489 Actuals Projections 50,010 50,000 48,669 46,919 45,533 44,224 41,788 39,900 40,000 38,031 36,068 34,484 32,850 30,000 20,000 10,000 0 9 2013-2014 2014-2015 2015-2016 2016-2017 2017-2018 2018-2019 2019-2020 2020-2021 2021-2022 2022-2023 2023-2024 2024-2025 2025-2026 2026-2027
39,000 38,031 38,000 37,000 36,318 36,000 36,068 34,741 35,000 34,484 34,000 33,114 33,000 32,850 32,000 31,000 30,000 2023-2024 2024-2025 2025-2026 2026-2027 First Interim At Adopted Budget 10
Source: CDE DataQuest Non-Charter Enrollment Orange County School Districts Name 2014-15 2015-16 2016-17 2017-18 2018-19 2019-20 2020-21 2021-22 2022-23 2023-24 Change Huntington Beach City Elementary 6,864 7,008 6,917 6,773 6,658 6,456 5,310 4,904 4,703 4,628 -32.6% Santa Ana Unified 52,638 51,383 49,792 48,326 46,597 45,215 43,917 41,504 39,603 37,663 -28.4% Savanna Elementary 2,392 2,397 2,331 2,272 2,199 2,095 1,949 1,843 1,806 1,735 -27.5% Anaheim Elementary 19,164 18,656 18,312 17,671 16,691 16,374 15,612 14,882 14,618 14,261 -25.6% Buena Park Elementary 4,985 4,869 4,837 4,684 4,552 4,464 4,133 4,015 3,966 3,784 -24.1% Ocean View Elementary 9,010 8,725 8,467 8,263 7,986 7,721 7,337 6,942 6,809 6,868 -23.8% Magnolia Elementary 6,403 6,418 6,277 6,080 5,851 5,678 5,385 5,121 5,001 4,920 -23.2% Laguna Beach Unified 3,074 3,029 3,025 2,929 2,861 2,788 2,634 2,578 2,456 2,386 -22.4% Newport-Mesa Unified 21,905 21,736 21,581 21,234 20,641 20,173 18,559 17,962 17,816 17,768 -18.9% Garden Grove Unified 46,177 45,252 44,223 43,163 42,301 41,423 40,124 38,560 38,164 37,763 -18.2% Capistrano Unified 49,838 49,117 48,256 47,899 47,205 46,501 43,719 42,754 41,855 40,836 -18.1% Saddleback Valley Unified 27,969 27,667 26,770 26,351 26,747 26,304 24,954 24,390 23,711 23,199 -17.1% Cypress Elementary 3,990 3,942 3,969 3,957 3,923 3,813 3,540 3,414 3,389 3,319 -16.8% Fullerton Elementary 13,678 13,520 13,363 13,307 13,067 12,852 12,141 11,681 11,626 11,439 -16.4% Westminster Elementary 9,503 9,401 9,338 9,264 9,120 9,036 8,607 8,203 8,149 7,950 -16.3% Orange Unified 27,320 26,716 26,298 25,749 25,246 25,070 24,268 24,078 23,656 23,145 -15.3% Orange County 485,100 479,628 473,317 467,571 459,930 453,967 435,711 426,434 418,667 412,461 -15.0% La Habra City Elementary 5,022 4,913 4,726 4,713 4,656 4,666 4,537 4,499 4,352 4,298 -14.4% Anaheim Union High 31,659 31,276 30,964 30,729 30,292 29,832 29,183 28,404 27,748 27,195 -14.1% Huntington Beach Union High 16,343 16,048 16,140 16,188 15,967 15,894 15,534 15,098 14,522 14,104 -13.7% Placentia-Yorba Linda Unified 25,595 25,826 25,798 25,741 25,477 25,162 24,296 23,657 23,138 22,705 -11.3% Fullerton Joint Union High 14,396 14,235 13,983 13,901 13,695 13,630 13,473 13,431 13,173 12,826 -10.9% Tustin Unified 24,059 24,079 24,130 24,015 23,768 23,521 22,761 22,140 21,830 21,600 -10.2% Los Alamitos Unified 9,914 9,948 9,904 9,833 9,730 9,697 9,317 9,133 8,934 8,931 -9.9% Statewide 5,690,540 5,653,985 5,625,398 5,591,564 5,533,345 5,487,627 5,311,866 5,214,183 5,166,991 5,128,055 -9.9% Centralia Elementary 4,491 4,437 4,417 4,327 4,221 4,218 4,044 4,077 4,129 4,052 -9.8% Fountain Valley Elementary 6,305 6,371 6,387 6,362 6,328 6,320 6,165 5,998 5,976 6,036 -4.3% Brea-Olinda Unified 5,977 5,856 5,909 5,951 6,008 6,085 5,990 5,866 5,811 5,895 -1.4% Irvine Unified 31,392 32,319 33,381 34,617 35,291 36,177 35,660 36,083 36,542 37,731 20.2% 11
Source: CDE DataQuest Non-Charter Enrollment Orange County Unified School Districts Name 2014-15 2015-16 2016-17 2017-18 2018-19 2019-20 2020-21 2021-22 2022-23 2023-24 Change Santa Ana Unified 52,638 51,383 49,792 48,326 46,597 45,215 43,917 41,504 39,603 37,663 -28.4% Laguna Beach Unified 3,074 3,029 3,025 2,929 2,861 2,788 2,634 2,578 2,456 2,386 -22.4% Newport-Mesa Unified 21,905 21,736 21,581 21,234 20,641 20,173 18,559 17,962 17,816 17,768 -18.9% Garden Grove Unified 46,177 45,252 44,223 43,163 42,301 41,423 40,124 38,560 38,164 37,763 -18.2% Capistrano Unified 49,838 49,117 48,256 47,899 47,205 46,501 43,719 42,754 41,855 40,836 -18.1% Saddleback Valley Unified 27,969 27,667 26,770 26,351 26,747 26,304 24,954 24,390 23,711 23,199 -17.1% Orange Unified 27,320 26,716 26,298 25,749 25,246 25,070 24,268 24,078 23,656 23,145 -15.3% Orange County 485,100 479,628 473,317 467,571 459,930 453,967 435,711 426,434 418,667 412,461 -15.0% Placentia-Yorba Linda Unified 25,595 25,826 25,798 25,741 25,477 25,162 24,296 23,657 23,138 22,705 -11.3% Tustin Unified 24,059 24,079 24,130 24,015 23,768 23,521 22,761 22,140 21,830 21,600 -10.2% Los Alamitos Unified 9,914 9,948 9,904 9,833 9,730 9,697 9,317 9,133 8,934 8,931 -9.9% Statewide 5,690,540 5,653,985 5,625,398 5,591,564 5,533,345 5,487,627 5,311,866 5,214,183 5,166,991 5,128,055 -9.9% Brea-Olinda Unified 5,977 5,856 5,909 5,951 6,008 6,085 5,990 5,866 5,811 5,895 -1.4% Irvine Unified 31,392 32,319 33,381 34,617 35,291 36,177 35,660 36,083 36,542 37,731 20.2% 12
55,000 52,638 Source: CDE DataQuest Non-Charter Enrollment 49,838 50,000 47,205 46,177 46,597 45,000 42,754 42,301 41,504 40,836 40,000 37,763 38,560 37,731 37,663 35,291 36,083 35,000 31,392 30,000 2014-15 2015-16 2016-17 2017-18 2018-19 2019-20 2020-21 2021-22 2022-23 2023-24 Capistrano Unified Garden Grove Unified Irvine Unified Santa Ana Unified 13
Variance Adopted -> First Interim 2024-2025 Adopted Budget 2024-2025 First Interim Revenue LCFF Sources Federal Revenue Other State Revenue Other Local Revenue $585,498,126 $40,174,611 $159,776,388 $33,421,695 $818,870,819 $577,184,010 $41,594,985 $159,964,430 $31,743,789 $810,487,213 -1.4% 3.5% 0.1% -5.0% -1.0% Total Variances LCFF Unduplicated Pupil Count Attendance Factor 14
$1,200,000,000 Actuals Projections $1,008,304,639 $1,000,000,000 $26,483,053 $892,058,856 $846,086,520 $54,225,954 $256,362,861 $810,487,213 $12,156,108 $798,535,711 $794,332,507 $800,000,000 $31,743,789 $753,300,558 $28,540,450 $28,804,335 $131,078,792 $166,763,268 $13,458,599 $670,402,985 $159,964,430 $161,951,228 $161,393,273 $120,120,728 $12,781,971 $128,270,478 $59,138,060 $160,405,073 $93,459,372 $600,000,000 $41,594,985 $35,614,740 $34,246,160 $114,129,573 $44,980,675 $400,000,000 $611,931,574 $597,188,247 $577,184,010 $572,429,293 $569,888,739 $542,446,547 $519,180,967 $505,591,658 $200,000,000 $0 2019-2020 2020-2021 2021-2022 2022-2023 2023-2024 2024-2025 2025-2026 2026-2027 LCFF Federal Other State Other Local Total 15
Other Local, $31,743,789 , 4% Other State, $159,964,430 , 20% Federal, $41,594,985 , 5% LCFF, $577,184,010 , 71% 16
$120,000,000 $99,454,182 $100,000,000 $94,347,041 $80,267,062 $80,000,000 $60,000,000 $55,943,545 $45,000,000 $40,000,000 $24,751,866 $20,000,000 $2,308,000 $0 2019-2020 2020-2021 2021-2022 2022-2023 2023-2024 2024-2025 2025-2026 17
Variance Adopted -> First Interim 2024-2025 Adopted Budget 2024-2025 First Interim Expenditures Certificated Salaries Classified Salaries Employee Benefits $362,689,191 $150,594,413 $264,911,817 $778,195,421 $376,115,814 $153,880,329 $266,054,902 $796,051,045 3.7% 2.2% 0.4% 2.3% Total Variances Certificated Classified Salary Increase Unfilled Positions Filled vacancies Paraprofessional Increases 18
$900,000,000 Projections Actuals $796,051,045 $800,000,000 $742,798,460 $714,139,253 $707,891,224 $705,784,833 $700,000,000 $266,054,902 $623,406,505 $242,366,014 $205,405,673 $600,000,000 $570,755,040 $222,246,888 $228,618,030 $551,034,390 $179,378,491 $500,000,000 $186,893,353 $160,982,368 $153,880,329 $137,103,767 $147,353,123 $155,095,798 $156,111,119 $400,000,000 $116,437,854 $112,170,751 $108,036,524 $300,000,000 $200,000,000 $376,115,814 $371,629,813 $353,079,323 $328,442,147 $327,590,160 $323,162,075 $277,881,271 $275,825,163 $100,000,000 $0 2019-2020 2020-2021 2021-2022 2022-2023 2023-2024 2024-2025 2025-2026 2026-2027 Certificated Salaries Classified Salaries Benefits 19
Variance Adopted -> First Interim 2024-2025 Adopted Budget 2024-2025 First Interim Expenditures Supplies Services Capital Other Outgo $35,979,265 $121,978,216 $23,854,865 $4,021,447 -$3,171,436 $182,662,357 $38,596,066 $127,978,736 $28,551,992 $4,091,447 -$3,270,019 $195,948,222 7.3% 4.9% 19.7% 1.7% 3.1% 7.3% Transfers (Indirect/Direct) Total Variances Supplies Services Capital Outlay Expanded Learning Equipment Carryover Expanded Learning 20
$250,000,000 Actuals Projections $196,008,936 $195,126,794 $200,000,000 $28,551,992 $50,201,915 $150,000,000 $138,169,092 $134,631,244 $127,282,383 $3,062,980 $12,618,365 $3,670,131 $96,575,237 $127,978,736 $58,540,752 $100,000,000 $91,843,870 $12,482,144 $112,570,600 $9,273,037 $88,391,751 $92,817,892 $70,431,410 $6,867,206 $61,075,187 $60,390,935 $50,000,000 $45,992,795 $73,027,512 $38,596,066 $35,220,500 $33,236,421 $32,732,835 $23,017,906 $22,179,898 $17,571,409 $0 2019-2020 2020-2021 2021-2022 2022-2023 2023-2024 2024-2025 2025-2026 2026-2027 Books & Supplies Services Capital Outlay 21
Other Outgo, $821,428, 0% Capital Outlay, $28,551,992, 3% Books & Supplies, $38,596,066, 4% Services, $127,978,736, 13% Certificated Salaries, $346,470,963, 35% Benefits, $266,054,902, 27% Classified Salaries, $139,095,654, 14% Mgmt Salaries, $44,429,525, 4% Salaries & benefits account for 80% of District expenditures ($796M of the $992M) 22
Actuals Projections $1,200,000,000 $997,824,113 $1,008,304,639 $1,000,000,000 $947,817,038 $846,086,520 $812,063,734 $798,535,711 $892,058,856 $753,300,558 $800,000,000 $862,015,141 $810,487,213 $674,071,265 $788,177,649 $674,363,687 $760,265,675 $655,298,589 $794,332,507 $670,402,985 $650,926,032 $600,000,000 $694,225,515 $644,298,597 $400,000,000 $200,000,000 $0 2017-2018 2018-2019 2019-2020 2020-2021 2021-2022 2022-2023 2023-2024 2024-2025 2025-2026 2026-2027 Total Revenue Total Expenditures 23
Actuals Projections $450,000,000 $418,263,344 $400,000,000 $350,000,000 $362,505,163 $300,000,000 $275,590,708 $250,000,000 $214,701,640 $200,000,000 $189,796,393 $167,795,098 $157,437,036 $175,168,263 $150,000,000 $135,014,632 $142,427,447 $146,443,223 $130,910,923 $100,000,000 $105,947,581 $50,000,000 $0 2017-2018 2018-2019 2019-2020 2020-2021 2021-2022 2022-2023 2023-2024 2024-2025 2025-2026 2026-2027 Ending Fund Balance (First Interim) Ending Fund Balance (Unaudited Actuals) 24
Reserved for Economic Uncertainties & Unspendable, $21,146,482.26 , 12% Unrestricted, $47,774,085.31 , 27% Other Restricted Funds, $54,073,591.83 , 31% ELOP Funds, $31,472,847.56 , 18% COVID Relief Grant Funds, $20,701,256.50 , 12% 25
Next Steps Short Term Review of Supplies, Services, and Capital Expenditures Reductions in Deferred Maintenance Contributions UPP Efforts in December and Early January Medium Term Review of Utilities and Waste Management Continued Review of Supplies, Services, and Capital Expenditures Long Term Consideration of Solar Improvements for GF Savings Continued Review of Supplies, Services, and Capital Expenditures 26
Budget Timeline Adopted LCAP & Budget 2024-2025 Fiscal Year Second Interim Period Unaudited Actuals Estimated Actuals First Interim Period 2024-2025 Budget Year Second Interim External Audit 2023-2024 External Audit First Interim JAN JUN JUL AUG SEP OCT NOV DEC FEB MAR APR MAY JUN JUL AUG SEP OCT NOV DEC 2023 2024 2025-2026 Budget Year JUN JUL AUG SEP OCT NOV DEC JAN FEB MAR APR MAY JUN JUL AUG SEP OCT NOV DEC Governor's Budget May Revision LCAP & Budget Hearings Adopted LCAP & Budget LCAP and Budget Development 27
Budget Discussions 2024-2025 Fiscal Year 2025-2026 Fiscal Year Second Interim Period First Interim Period 1/15/2025 Labor Partners 3/18/2025 Labor Partners Second Interim 2024-2025 Budget Year First Interim 1/26/2025 Leadership 3/26/2025 Leadership 12/18/2024 Webinar 3/18/2025 Webinar 12/19/2024 Town Hall DEC 3/19/2025 Town Hall APR MAR JUN JUL AUG SEP 2023 OCT NOV JAN FEB MAY JUN JUL AUG SEP OCT NOV DEC 2024 2023-2024 Budget Year JUN JUL AUG SEP OCT NOV DEC JAN FEB MAR APR MAY JUN JUL AUG SEP OCT NOV DEC 10/9/2024 Labor Partners Unaudited Actuals 9/25/2024 Leadership 9/30/2024 Town Hall 28
Budget Discussions 2024-2025 Fiscal Year 2025-2026 Fiscal Year Second Interim Period First Interim Period 1/15/2025 Labor Partners 3/18/2025 Labor Partners Second Interim 2024-2025 Budget Year First Interim 1/26/2025 Leadership 3/26/2025 Leadership 12/18/2024 Webinar 3/18/2025 Webinar 12/19/2024 Town Hall DEC 3/19/2025 Town Hall APR MAR JUN JUL AUG SEP 2023 OCT NOV JAN FEB MAY JUN JUL AUG SEP OCT NOV DEC 2024 2023-2024 Budget Year JUN JUL AUG SEP OCT NOV DEC JAN FEB MAR APR MAY JUN JUL AUG SEP OCT NOV DEC 10/9/2024 Labor Partners Unaudited Actuals 9/25/2024 Leadership 9/30/2024 Town Hall 29
Thank you! Questions? 30