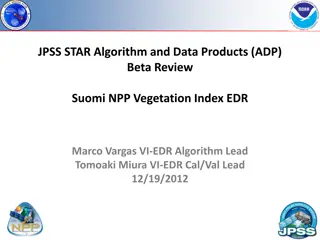
Satellite Image Analysis for Vegetation Indices
Photosynthetically Active Radiation (PAR) plays a crucial role in satellite image analysis for vegetation indices. Various Vegetation Indices (VIs) are used to monitor terrestrial photosynthetic activity and canopy structural variations. Remote sensing technology has allowed scientists to track changes in vegetation attributes, such as leaf area index, green cover percentage, chlorophyll content, and green biomass. Understanding the absorption spectra of chlorophyll and carotenoids, as well as the PAR action spectrum, helps enhance the reliability of spatial and temporal comparisons in satellite image analysis. Dr. Aurass Muhi Taha specializes in utilizing these indices for vegetation analysis and monitoring.

Download Presentation

Please find below an Image/Link to download the presentation.
The content on the website is provided AS IS for your information and personal use only. It may not be sold, licensed, or shared on other websites without obtaining consent from the author.If you encounter any issues during the download, it is possible that the publisher has removed the file from their server.
You are allowed to download the files provided on this website for personal or commercial use, subject to the condition that they are used lawfully. All files are the property of their respective owners.
The content on the website is provided AS IS for your information and personal use only. It may not be sold, licensed, or shared on other websites without obtaining consent from the author.
E N D
Presentation Transcript
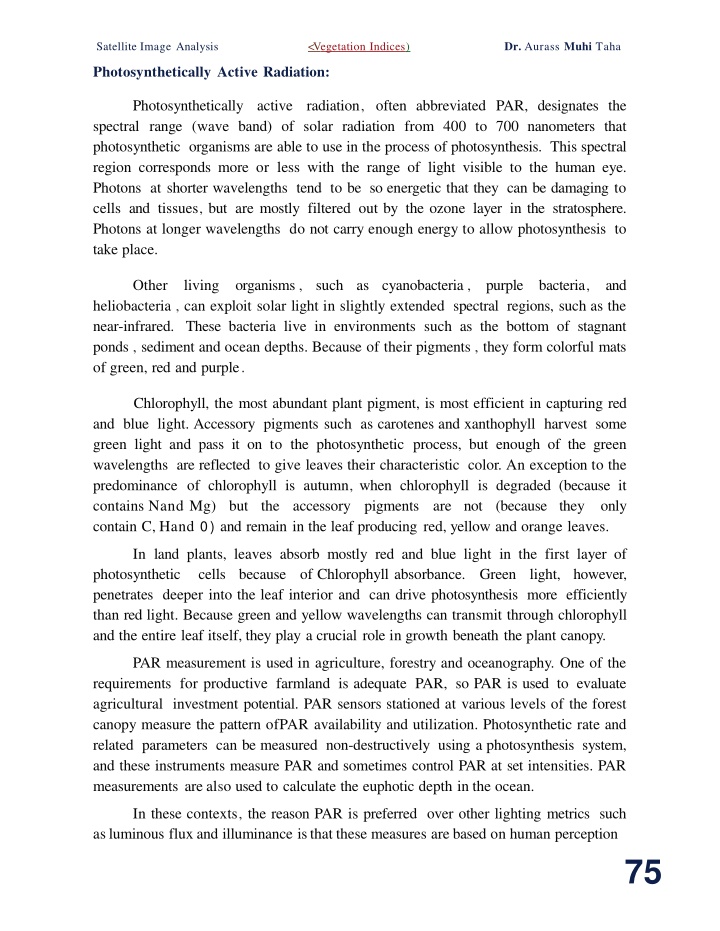
Dr. Aurass Muhi Taha Satellite Image Analysis <Vegetation Indices) Photosynthetically Active Radiation: Photosynthetically active spectral range (wave band) of solar radiation from 400 to 700 nanometers that photosynthetic organisms are able to use in the process of photosynthesis. This spectral region corresponds more or less with the range of light visible to the human eye. Photons at shorter wavelengths tend to be so energetic that they can be damaging to cells and tissues, but are mostly filtered out by the ozone layer in the stratosphere. Photons at longer wavelengths do not carry enough energy to allow photosynthesis to take place. radiation, often abbreviated PAR, designates the Other living organisms , such as cyanobacteria , purple bacteria, and heliobacteria , can exploit solar light in slightly extended spectral regions, such as the near-infrared. These bacteria live in environments such as the bottom of stagnant ponds , sediment and ocean depths. Because of their pigments , they form colorful mats of green, red and purple. Chlorophyll, the most abundant plant pigment, is most efficient in capturing red and blue light. Accessory pigments such as carotenes and xanthophyll harvest some green light and pass it on to the photosynthetic process, but enough of the green wavelengths are reflected to give leaves their characteristic color. An exception to the predominance of chlorophyll is autumn, when chlorophyll is degraded (because it contains Nand Mg) but the accessory pigments contain C, Hand 0) and remain in the leaf producing red, yellow and orange leaves. are not (because they only In land plants, leaves absorb mostly red and blue light in the first layer of photosynthetic cells because of Chlorophyll absorbance. penetrates deeper into the leaf interior and can drive photosynthesis more efficiently than red light. Because green and yellow wavelengths can transmit through chlorophyll and the entire leaf itself, they play a crucial role in growth beneath the plant canopy. Green light, however, PAR measurement is used in agriculture, forestry and oceanography. One of the requirements for productive farmland is adequate PAR, so PAR is used to evaluate agricultural investment potential. PAR sensors stationed at various levels of the forest canopy measure the pattern ofPAR availability and utilization. Photosynthetic rate and related parameters can be measured non-destructively using a photosynthesis system, and these instruments measure PAR and sometimes control PAR at set intensities. PAR measurements are also used to calculate the euphotic depth in the ocean. In these contexts, the reason PAR is preferred over other lighting metrics such asluminous flux and illuminance isthat these measures are based on human perception 75
SatelliteImage Analysis <Vegetation Indices) Dr. Aurass Muhi Taha of brightness, which is strongly green biased and does not accurately describe the quantity of light usable for photosynthesis. 100 80 '* c . Q 40 a. 0 ( / ) . 0 <( 60 20 80 I L -- - - = 2 rGa: C/) u; 601 - - 40 - 20 .ca.. 500 Wavelength (nm) 600 700 Top: Absorption spectra for chlorophyll-A, chlorophyll-B, and carotenoids extracted in a solution. Bottom: PAR action spectrum (oxygen evolution per incident photon) of an isolated chloroplast. Vegetation Indices: A Vegetation Index (VI) is a spectral transformation of two or more bands designed to enhance the contribution of vegetation properties and allow reliable spatial and temporal inter-comparisons of terrestrial photosynthetic activity and canopy structural variations. There are many Vegetation Indices (VIs), with many being functionally equivalent. Many of the indices make use of the inverse relationship between red and near-infrared reflectance associated with healthy green vegetation. Since the 1960s scientists have used satellite remote sensing to monitor fluctuation in vegetation at the Earth's surface. Measurements of vegetation attributes include leaf area index (LAI), percent green cover, chlorophyll content, photosynthetically active radiation (APAR). green biomass and absorbed 76
Dr. Aurass Muhi Taha Satellite Image Analysis <Vegetation Indices) Vegetation Indices (VIs) have been historically classified based on a range of attributes, including the number of spectral bands (2 or greater than 2); the method of calculations (ratio or orthogonal), depending on the required objective; or by their historical development (classified as first generation VIs or second generation VIs). Due to advances in hyperspectral remote sensing technology, high-resolution reflectance spectrums are now available, which can be used with traditional multispectral VIs. In addition, VIs have been developed to be used specifically with hyperspectral data, such as the use ofNarrow Band Vegetation Indices. 1) Normalized Difference Vegetation Index: The normalized difference vegetation index (NDVI) is a simple graphical indicator that can be used to analyze remote sensing measurements , typically , but not necessarily, from a space platform, and assess whether the target being observed contains live green vegetation or not. Live green plants absorb solar radiation in the photosynthetically active radiation (PAR) spectral region, which they use as a source of energy in the process of photosynthesis. Leaf cells have also evolved to re-emit solar radiation in the near infrared spectral region (which carries approximately half of the total incoming solar energy), because the photon energy at wavelengths longer than about 700 nanometers is too large to synthesize organic molecules. A strong absorption at these wavelengths would only result in overheating the plant and possibly damaging the tissues. Hence, live green plants appear relatively dark in the PAR and relatively bright in the near infrared. By contrast, clouds and snow tend to be rather bright in the red (as well as other visible wavelengths) and quite dark in the near-infrared. The pigment in plant leaves, chlorophyll , strongly absorbs visible light (from 0.4 to 0.7 11m) for use in photosynthesis. The cell structure of the leaves, on the other hand , strongly reflects near-infrared light (from 0.7 to 1.1 11m). The more leaves a plant has, the more these wavelengths of light are affected, respectively. The NDVI is calculated from these individual measurements as follows: NIR- Red NIR +Red N D V I = - - - Where red and NIR stand for the spectral reflectance measurements acquired in the red (visible) and near-infrared regions , respectively. These spectral reflectances are themselves ratios of the reflected over the incoming radiation in each spectral band individually , hence they take on values between 0.0 and 1.0. Bydesign, the NDVI itself thus varies between (-1.0) and(+1.0). 77
SatelliteImage Analysis Dr. Aurass Muhi Taha (0.4- 0.30) ..0.14 (0.4 +0.30) (0.50- 0.08) ..0.72 (O.SO+ 0.08) It should be noted that NDVI is functionally, but not linearly, equivalent to the simple infrared/red ratio (NIRNIS). The advantage ofNDVI over a simple infrared/red ratio is therefore generally limited to any possible linearity of its functional relationship with vegetation properties (e.g. biomass). The simple ratio (unlike NDVI) is always positive, which may have practical advantages, but it also has a mathematically infinite range (0 to infinity), which can be a practical disadvantage as compared to NDVI. Also in this regard, note that the VIS term in the numerator ofNDVI only scales the result, thereby creating negative values. NDVI is functionally and linearly equivalent to the ratio NIR I (NIR+VIS), which ranges from 0 to 1 and is thus never negative nor limitless in range. But the most important concept in the understanding of the NDVI algebraic formula is that, despite its name, it is a transformation of a spectral ratio (NIRIVIS), and ithas no functional relationship to a spectral difference (NIR-VIS). In general, if there is much more reflected radiation in near-infrared wavelengths than in visible wavelengths, then the vegetation in that pixel is likely to be dense and may contain some type of forest. Subsequent work has shown that the ND VI is directly related to the photosynthetic capacity and hence energy absorption of plant canopies. Although the index admits to go from -1 to 1, even in more densely populated urban areas the value of normal NDVI is positive, although closer to zero. Negative values are more likely to be disturbed in the atmosphere and some specific materials. Performance and limitations of NDVI: It can be seen from its mathematical definition that the NDVI of an area containing a dense vegetation canopy will tend to positive values (say 0.3 to 0.8) while78
Dr. Aurass Muhi Taha Satellite Image Analysis <Vegetation Indices) clouds and snow fields will be characterized by negative values of this index. Other targets on Earth visible from space include: 1)free standing water (e.g., oceans, seas, lakes and rivers) which have a rather low reflectance in both spectral bands (at least away from shores) and thus result in very low positive or even slightly negative NDVI values, 2)Soils which generally exhibit a near-infrared spectral reflectance somewhat larger than the red, and thus tend to also generate rather small positive NDVI values (say 0.1 to 0.2). In addition to the simplicity of the algorithm and its capacity to broadly distinguish vegetated areas from other surface types, the NDVI also has the advantage of compressing the size of the data to be manipulated by a factor 2 (or more), since it replaces the two spectral bands by a single new field (eventually coded on 8 bits instead of the 10 or more bits of the original data). The NDVI has been widely used in applications for which it was not originally designed. Using the NDVI for quantitative assessments (as opposed to qualitative surveys as indicated above) raises a number of issues that may seriously limit the actual usefulness of this index ifthey are not properly addressed. The following subsections review some of these issues. 3)Mathematically, the sum and the difference ofthe two spectral channels contain the same information as the original data, but the difference alone (or the normalized difference) carries only part ofthe initial information. Whether the missing information is relevant or valuable is for the user to judge, but it is important to understand that an NDVI product carries only a fraction of the information available in the original spectral reflectance data. 4)Users ofNDVI have tended to estimate a large number of vegetation properties from the value of this index. Typical examples include the Leaf Area Index, biomass, chlorophyll concentration in leaves, plant productivity, fractional vegetation cover, accumulated rainfall, etc. Such relations are often derived by correlating space-derived NDVI values with ground-measured values of these variables. This approach raises further issues related to the spatial scale associated with the measurements, as satellite sensors always measure radiation quantities for areas substantially larger than those sampled by field instruments. Furthermore, it is of course illogical to claim that all these relations hold at once, because that would imply that all of these environmental properties would be directly and unequivocally related between themselves. 5)The reflectance measurements should be relative to the same area and be acquired simultaneously. This may not be easy to achieve with instruments that acquire different 79
Dr. Aurass Muhi Taha Satellite Image Analysis <Vegetation Indices) spectral channels through different cameras or focal planes. Mis-registration of the spectral images may lead to substantial errors and unusable results. Also, the calculation of the NDVI value turns out to be sensitive to a number of perturbing factors including: 1)Atmospheric effects: The actual composition of the atmosphere (in particular with respect to water vapor and aerosols) can significantly affect the measurements made in space. Hence, the latter may be misinterpreted if these effects are not properly taken into account (as is the case when the NDVI is calculated directly on the basis of raw measurements). 2)Clouds: Deep (optically thick) clouds may be quite noticeable in satellite imagery and yield characteristic NDVI values that ease their screening. However, thin clouds (such as the ubiquitous cirrus), or small clouds with typical linear dimensions smaller than the diameter of the area actually sampled by the sensors, can significantly contaminate the measurements. Similarly, cloud shadows in areas that appear clear can affect NDVI values and lead to misinterpretations. These considerations are minimized by forming composite images from daily or near-daily images. 3)Soil effects: Soils tend to darken when wet, so that their reflectance is a direct function of water content. If the spectral response to moistening is not exactly the same in the two spectral bands, the NDVI of an area can appear to change as a result of soil moisture changes (precipitation or evaporation) and not because of vegetation changes. 4)Anisotropic effects: All surfaces (whether natural differently in different directions, and this form of anisotropy is generally spectrally dependent, even ifthe general tendency may be similar in these two spectral bands. As a result, the value ofNDVI may depend on the particular anisotropy of the target and on the angular geometry of illumination and observation at the time of the measurements, and hence on the position of the target of interest within the swath of the instrument or the time of passage of the satellite over the site. This is particularly crucial in analyzing AVHRR data since the orbit of the NOAA platforms tended to drift in time. At the same time, the use of composite NDVI images minimizes these considerations and has led to global time series NDVI data sets spanning more than 25 years. or man-made) reflect light 5)Spectral effects: Since each sensor has its own characteristics and performances, in particular with respect to the position, width and shape of the spectral bands, a single 80
Satellite Image Analysis <Vegetation Indices) Dr. Aurass Muhi Taha formula like NDVI yields different results when applied to the measurements acquired by different instruments. 2) Enhanced Vegetation Index (EVI): The enhanced vegetation index (EVI) is an 'optimized' vegetation index designed to enhance the vegetation signal with improved sensitivity in high biomass regions and improved vegetation monitoring through a de-coupling of the canopy background signal and a reduction in atmosphere influences. EVI is computed following this equation: NIR- Red EVI = G*- - - - - - - - - - - - - - - - - - - - - - - [(NIR + C1) *Red] - [C2 *(Blue+ L)] where NIR/red /bl ue are atmospherically-corrected corrected (Rayleigh and ozone absorption) surface reflectance's, L is the canopy background adjustment that addresses non-linear, differential NIR and red radiant transfer through a canopy, and C1, C2are the coefficients of the aerosol resistance term, which uses the blue band to correct for aerosol influences in the red band. The coefficients adopted in the MODIS-EVI algorithm are G (gain factor)= 2.5 . or partially atmosphere L=l, C1= 6, C2 = 7.5, and 3) Soil-adjusted Vegetation Index (SAVI): Empirically derived NDVI products have been shown to be unstable, varying with soil colour, soil moisture, and saturation effects from high density vegetation. In an attempt to improve NDVI, Huete developed a vegetation index that accounted for the differential red and near-infrared extinction through the vegetation canopy. The index is a transformation technique that minimizes soil brightness influences from spectral vegetation indices involving red and near-infrared (NIR) wavelengths .The index is given as: (1+ L)(NIR- Red) S A V I = - - - - - - NIR+Red+L Where L is a canopy background adjustment factor. An L value of 0.5 in reflectance space was found to minimize soil brightness variations and eliminate the need for additional calibration for different soils. (1.5)(NIR- Red) SAVI = NIR +Red+ 0.5 The transformation was found to nearly eliminate soil-induced variations in vegetation indices. 81