Scaling Exercise and Recommendations for COE Analysis
This document provides detailed insights into COE scaling exercise and recommendations, with a focus on efficiency improvements and cost optimization strategies for a confidential company project. Key areas covered include nameplate ratings, rotor diameter, control methods, and cost contributions by different operational areas.

Download Presentation

Please find below an Image/Link to download the presentation.
The content on the website is provided AS IS for your information and personal use only. It may not be sold, licensed, or shared on other websites without obtaining consent from the author.If you encounter any issues during the download, it is possible that the publisher has removed the file from their server.
You are allowed to download the files provided on this website for personal or commercial use, subject to the condition that they are used lawfully. All files are the property of their respective owners.
The content on the website is provided AS IS for your information and personal use only. It may not be sold, licensed, or shared on other websites without obtaining consent from the author.
E N D
Presentation Transcript
COE Scaling Exercise and Recommendations Tyler Mayer 05/03/13 Company Confidential and Proprietary
COE vs. Nameplate Rating Name Plate Rating kW 2400 1500 1500 1700 1050 800 500 360 Florida Current /kWh 10.4 10.7 14.7 12.1 12.7 13.7 14.9 16.5 % Difference % - 3% 41% 16% 22% 31% 44% 58% Rotor Diameter m 45.5 34.9 34.9 35.9 28.6 24.9 19.8 16.7 Control Strategy - Ideal PDC* Ideal PDC Current Design Stall** Stall Stall Stall Stall Input Pump # 2X CBM 6000 CBM 6000 CBM 6000 2X CBM 6000 CBM 6000 CBM 4000 CBM 2000 CBM CBP 1200 18.0 Current Design @ 1.6 m/s 16.0 CBM 6000 Options 14.0 Required PDC Optimization 12.0 Stall Control (cut out @ 2.0 m/s) 10.0 /kWh 8.0 6.0 Florida Target I-PDC @ 1.6 m/s 4.0 Stall Control Ideal PDC 2.0 Current PDC Name Plate Rating (kW) 0.0 0 500 1000 1500 2000 2500 * Ideal PDC COE does not include additional component cost (if required) to achieve anticipated operation ** Stall Control COE does include any cost reduction due to simplfied mooring, pressure vessel or seals Company Confidential and Proprietary 1
COE Options @ CBM 6000 Name Plate Rating Florida Current % Difference Rotor Diameter kW /kWh 1050 12.6 1500 10.7 1500 14.9 2000 13.4 Control Method - Stall 2.0 Ideal PDC 1.6 Current Design 1.6 Current PDC 1.8 Input Pump # CBM 6000 CBM 6000 CBM 6000 CBM 6000 % m 21% 3% 43% 29% 28.6 34.9 34.9 32.3 16.0 Current Design @ 1.6 14.0 12.0 10.0 /kWh Stall Control (cut out @ 2.0 m/s) 8.0 6.0 Florida Target C-PDC @ 1.8 m/s 4.0 I-PDC @ 1.6 m/s Stall 2.0 2.0 0.0 0 500 1000 Name Plate Rating (kW) 1500 2000 2500 Company Confidential and Proprietary 2
COE Contribution by Area Name Plate Rating kW 2400 1700 1050 800 500 360 OPEX Platform Drivetrain Mooring Grid Connect Installation /kWh 2.8 3.6 4.1 4.9 5.4 6.2 /kWh 2.0 2.0 1.9 1.8 1.7 1.5 /kWh 2.0 2.2 2.0 2.0 2.1 2.0 /kWh 0.4 0.6 0.7 0.8 1.1 1.3 /kWh 0.7 0.7 0.9 0.9 1.2 1.4 /kWh 0.8 1.0 1.2 1.5 1.6 2.2 7.0 OPEX Installation 6.0 Grid Connect Mooring Drivetrain 5.0 Platform COE ( /kWh) 4.0 3.0 2.0 1.0 kW Rating 0.0 0 500 1000 1500 2000 2500 Company Confidential and Proprietary 3
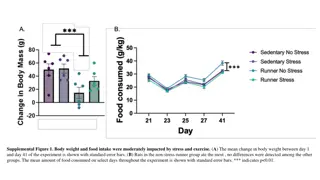
OPEX Scaling 5 year Maintenance The current estimation of installation cost is a fixed percentage of the CAPEX for the drivetrain and platform. 2400 Number of C-Planes, # 42 Farm Size, MW 100 Installation cost ($/C-Plane): $950,000 Parts Refurbisment Mooring Refurbisment $150,120 Hydraulic System Overhaul (seals, etc.) $182,788 Hydraulic Oil and Filters $13,000 Cleaning and Painting $19,600 Dissassebly and Reassembly $338,772 Misc Parts Replacement (5%) $338,772 1700 59 100 $950,000 1050 96 100 $730,000 800 134 100 500 200 100 360 277 100 Comments $730,000 $510,000 $510,000 From Install Cost $136,213 $154,394 $13,000 $19,600 $247,738 $247,738 $108,515 $84,215 $6,500 $15,680 $144,903 $144,903 $94,477 $63,171 $4,276 $13,067 $105,223 $105,223 $75,126 $44,606 $2,378 $6,969 $66,881 $66,881 $63,364 $30,083 $1,331 $3,252 $44,556 $44,556 20% Mooring Cost 20% Pump Cost BOM Cost Estimated and Scaled on Nacelle Volume Assembly Cost Misc 5% of BOM Parts Replacement 5yr Overhaul Total Cost ($/C-Plane/ 5yr) Yearly Cost ($/C-Plane/yr) Tax Adjusted Cost 1,993,051 398,610 239,166 1,768,683 353,737 212,242 1,234,716 246,943 148,166 1,115,436 223,087 133,852 772,840 154,568 92,741 697,142 139,428 83,657 Occurs every 5 years Divide by 5 40% Tax Rate Failure cost The current estimation of installation cost is a fixed percentage of the CAPEX for the drivetrain and platform. 2400 Remove and Replace [$] $950,000 Yearly Failure Rate 6.0% Number of Failures per year, #/yr 2.5 Average Cost of Failure $1,475,234 Number of days OOS 7.0 Liquidated Damages $43,546 1700 $950,000 6.0% 3.5 $1,102,588 7.0 $30,845 1050 $950,000 6.0% 5.8 $638,135 7.0 $19,051 800 500 360 $950,000 6.0% 8.0 $460,638 7.0 $14,515 $712,500 6.0% 12.0 $293,004 10.5 $13,608 $475,000 6.0% 16.6 $193,327 14.0 $13,064 2 days all ships to remove and install Constant failure rate Failure rate * units per farm 1/2 BOM cost of single power pod Total LRC cost ($/farm/yr) LRC Cost ($/C-Plane/yr) $6,213,500 $144,500 $7,366,078 $124,849 $9,245,750 $11,443,819 $12,213,958 $96,310 $85,402 $11,310,477 $40,832 $61,070 Asssumed 144k baseline to determine failure rate $383,666 2.8 $337,091 3.6 $244,476 4.1 $219,254 4.9 $153,811 5.4 $124,489 6.2 Total OPEX ($/C-Plane/yr) Total OPEX COE ( /kWh) 2.4 MW LRC of 144k is assumed from previous analysis and used to estimate failure rate Assumes same architecture, design practice and failure rates across configurations Requires detailed analysis of O&M and LRC to estimate true costs/ COE impact Scaling is accurate for comparison. Company Confidential and Proprietary 4
Failure LRC Modeling 2400 Component Cost Total Repair Cost 42 - 0.200 $783,592 0.100 $783,592 0.100 $2,950,468 0.100 $874,500 0.400 $1,014,526 0.400 $113,600 0.400 $2,950,468 0.400 $113,600 0.400 $1,014,526 0.400 $589,395 0.100 $750,600 0.100 $1,185,609 3.097 $6,069,000 $144,500 1700 Component Cost Total Repair Cost 59 - 0.281 $471,903 0.140 $471,903 0.140 $2,205,177 0.140 $544,410 0.561 $865,556 0.561 $80,467 0.561 $2,205,177 0.561 $80,467 0.561 $865,556 0.561 $337,896 0.140 $681,066 0.140 $879,214 4.351 $7,426,542 $125,874 Component kW Rating # of Turbines Average Failures/ Yr Average Failures/ Yr Average Failures/ Yr Average Failures/ Yr Average Failures/ Yr Average Failures/ Yr Average Failures/ Yr Average Failures/ Yr Average Failures/ Yr Average Failures/ Yr - - - $1,733,592 $1,733,592 $3,900,468 $1,824,500 $1,964,526 $1,063,600 $3,900,468 $1,063,600 $1,964,526 $1,539,395 $1,700,600 $2,135,609 $1,421,903 $1,421,903 $3,155,177 $1,494,410 $1,815,556 $1,030,467 $3,155,177 $1,030,467 $1,815,556 $1,287,896 $1,631,066 $1,829,214 Blades Rotor Hubs Nacelle Main Wing and Faring Pump Electrical Seals Generator Hydraulic System Bearings Mooring Lines & Attachments Average Failures/ Yr Grid Connect Average Failures/ Yr Total Yearly Failures Total Yearly Cost Cost /Year/Turbine Preliminary analysis used only to validate LRC scaling method Needs full review of failure frequency and costs Company Confidential and Proprietary 5
Scaling Exercise Recommendations Scaling exercise shows that a smaller rated machine may is commercially viable. Recommendation is a single CBM 6000 drivetrain. This architecture provides: Configuration similarity to higher ratings Bearings, Shafts, Seals and Nacelle design can accommodate higher ratings Room to grow The single 6000 architecture can increase capacity with the addition of a stacked pump. Margin to learn A smaller design will allow headroom for unanticipated loading Lower cost A smaller machine will be easier and cheaper to manufacture a prototype. Company Confidential and Proprietary 6
Prototype Cost Estimates C-Plane Prototype Cost Estimate Total CAPEX Installed Addititional prototype cost Blade Molds Install Ship Mobilization Permitting Estimated Prototype cost Development Engineering Total Development Spend Rating $/kw Protype Cost $/kw Project Development QTY 2400 Cost $8,969,303 $1,505,207 $5,000,000 $1,580,000 $1,500,000 $18,554,510 $13,988,576 $15,000,000 $15,000,000 $12,000,000 $10,000,000 $33,554,510 $28,988,576 $21,960,908 $18,442,491 $14,641,603 $13,749,329 2400 1600 1000 $7,731 $8,743 $9,961 $13,981 $18,118 $21,961 1600 Cost $6,831,452 $1,105,224 $2,971,901 $1,580,000 $1,500,000 1000 Cost $4,332,489 $676,238 $1,872,180 $1,580,000 $1,500,000 $9,960,908 750 Cost $3,427,755 $505,995 $1,428,741 $1,580,000 $1,500,000 $8,442,491 500 Cost $2,322,420 $339,133 $900,050 $1,580,000 $1,500,000 $6,641,603 $8,000,000 350 Cost $1,790,214 $238,837 20% additional BOM Cost $640,278 Scaled on Rotor Area $1,580,000 $1,500,000 $5,749,329 $8,000,000 Scaling Factor 10% Grid Connect Cost From quote Estimated Estimated 750 500 350 $11,257 $24,590 $13,283 $29,283 $16,427 $39,284 Company Confidential and Proprietary 7
Island Nation Estimate Finding COE Targets Updated: 12-Oct-11 Current breakdown COE % of CAPEX Value % Change Unit (cents/kWh) 32.25 COE % 100.0% Total k$ k$ k$ k$ k$ k$ CAPEX (without margin) Platform Drivetrain Mooring lines & attachments Grid connect Misc (assembly & installation) 2,334 342 593 309 458 631 13% 0% 18% 0% 27% 13% 16.00 2.35 4.07 2.12 3.14 4.33 49.6% 7% 13% 7% 10% 13% 100% 15% 25% 13% 20% 27% Gross margin (28%) 484 8% k$ 3.32 10.3% 28% k$ / yr O&M 151 23% 12.93 40.1% 25.1% MWh / yr AEP_net 1,167 -40% Assumes 20 - 350 kW Unit Site. Estimated variable flow Indonesian resource (limited data). 40% AEP loss due to variable resource. 20% increase in drivetrain cost to handle increased torque of variable flow. Increase in Grid Connect, Installation and O&M due to economies of scale. Company Confidential and Proprietary 8
DOE FOA Implications FOA Topic 2 Proposal ($3m) Develop and Test Fully Integrated CBM 6000 drivetrain at NREL System control and dynamics Off axis loading performance Include Seawater Bearings & Seals with pressure housing Bearing wear performance under load Seal performance under pressure and deflection In collaboration with: Tom Foley Hydraulic System Design - ($150k) BEW Electrical System Design - ($150k) Ettem Seal Design and Supply - ($350k) University of Florida - Bearing Design - ($250k) Bosch Rexroth Hydraulic System Supply - ($1m) NREL - Test Stand and Support - ($800k) Company Confidential and Proprietary 9