Scarcity, Choice, and Opportunity Cost in Economics
Learn about the fundamental concepts of scarcity, choice, and opportunity cost in economics. Understand how individuals, firms, and countries make decisions based on constraints they face, and how every choice involves a cost known as opportunity cost. Explore examples of opportunity cost and the production possibilities curve in an economy.
Download Presentation

Please find below an Image/Link to download the presentation.
The content on the website is provided AS IS for your information and personal use only. It may not be sold, licensed, or shared on other websites without obtaining consent from the author. If you encounter any issues during the download, it is possible that the publisher has removed the file from their server.
You are allowed to download the files provided on this website for personal or commercial use, subject to the condition that they are used lawfully. All files are the property of their respective owners.
The content on the website is provided AS IS for your information and personal use only. It may not be sold, licensed, or shared on other websites without obtaining consent from the author.
E N D
Presentation Transcript
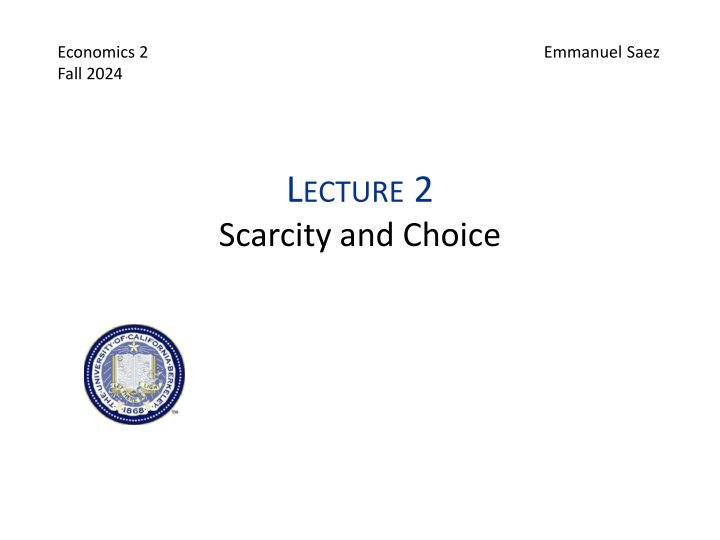
Economics 2 Emmanuel Saez Fall 2024 LECTURE 2 Scarcity and Choice
Scarcity Economists Definition: Someone or something faces a constraint. People, firms, and countries all face constraints on what they can consume or produce At a point in time, constraints are given. But they can change over time. A central subject of economics: How people, firms, and whole countries do the best they can, taking into account the constraints they face.
Choice Because individuals, firms, and whole countries face constraints, they have to make choices. Every choice has a cost. We refer to this cost as the opportunity cost.
Opportunity Cost Definition: The value of what must be forgone to undertake an activity. Opportunity cost is often obvious. For example, if often reflects trade-offs in the production process. The opportunity cost of a good bought in the market is typically its price.
More Subtle Examples of Opportunity Cost Going to college. Out-of-pocket costs (tuition, books) and forgone earnings while in school Painting your own house. Out-of-pocket costs (paint, brushes), the value of your time Using theater tickets whose market price has changed since you bought them. What you could sell the tickets for at the time of use (plus the value of your time).
Production Possibilities Curve (PPC) Diagram showing the combinations of two types of goods that could be produced in an economy just using all of the available inputs: Labor (people s time for work and abilities) Capital (land, buildings, machines, factories, know-how) First example of an economic model.
Example: The PPC for the U.S. Economy Dividing Production into Consumption vs. Investment Goods Consumption Goods: Goods (and services) that satisfy some current want for people. Examples: Food, clothing, housing, policing Investment Goods: Goods (and services) that will make us more productive in the future. Examples: Machines, buildings, infrastructure, education, R&D (=research and development by firms) Quantitatively: 75% of US Production is for consumption and 25% for gross investment
PPC for Consumption and Investment Goods Investment Goods (I) Consumption Goods (C)
PPC for Consumption and Investment Goods Investment Goods (I) PPC Consumption Goods (C)
Using the PPC to Visualize Scarcity and Choice I c a b PPC C
Using the PPC to Visualize Scarcity and Choice I c a b PPC C Scarcity is reflected by the fact that some combinations (such as c) are unattainable. Choice is reflected by the fact that a country has to choose which attainable combination to actually produce.
Opportunity Cost and the PPC I PPC C
Opportunity Cost and the PPC I I PPC C 1 The slope of the PPC is (minus) the opportunity cost of the good on the horizontal axis.
What Does It Mean If the PPC Is Curved? I I I PPC C 1 1 A curved PPC implies that the opportunity cost of the good on the horizontal axis is rising as more is produced (e.g., it becomes harder and harder to produce oil in a country)
PPC for Consumption and Investment Goods Immigration or Other Labor Force Growth I PPC1 C
PPC for Consumption and Investment Goods Immigration or Other Labor Force Growth I PPC2 PPC1 C
PPC for Consumption and Investment Goods Choices Today May Affect PPC in the Future I a b PPCToday C
PPC for Consumption and Investment Goods Choices Today May Affect PPC in the Future I a PPCFuture (a) b PPCToday C
PPC for Consumption and Investment Goods Choices Today May Affect PPC in the Future I a b PPCToday C
PPC for Consumption and Investment Goods Choices Today May Affect PPC in the Future I a PPCFuture (b) b PPCToday C
Quiz: Question: An economy s PPC slopes down (rather than up) because: A. There are trade offs B. We are looking at just one economy C. There are only two types of output D. I don t know
PPC, Productive Efficiency and Recession Productive efficiency is when it is impossible to produce more of something without having to decrease the production of something else A recession is a time when unemployment is above normal and the economy is not producing at its full potential. Most recent example is COVID recession when a significant part of the economy shut down (such as restaurants) and many workers lost their jobs
How Does a Recession Show up in the PPC Diagram? I d PPC C At a point such as d, the economy is not producing all it is capable of.
IV. SPECIALIZATIONANDTHE CURVATUREOFTHE PRODUCTION POSSIBILITIES CURVE
Two Fundamental Building Blocks Scarcity, choice, and opportunity cost. Comparative advantage and the gains from specialization.
Example: Specialization in a Two-Person Economy Two goods: fish and coconuts. Abilities: In an hour, Bill can catch 1 fish or gather 1 coconut. In an hour, Chris can catch 8 fish or gather 2 coconuts. Each of them works 10 hours a day.
Production Possibilities Curve (PPC) Diagram showing the combinations of two types of goods that could be produced in an economy just using all of the available inputs. In this case, the two goods are fish and coconuts. We will draw the PPC for a day. Recall, the slope of the PPC is (minus) the opportunity cost of the good on the horizontal axis.
Island PPC without Specialization Fish 00 Coconuts
Opportunity Cost When Chris and Bill Allocate Their Time the Same Way (No Specialization) In an hour, they could catch 9 fish (1 from Bill and 8 from Chris). Or they could gather 3 coconuts (1 from Bill and 2 from Chris). So, they trade off 9 fish for 3 coconuts. The opportunity cost of 1 coconut is 3 fish.
Island PPC without Specialization Fish 90 00 Coconuts 30
Island PPC without Specialization Fish 90 Slope is 3, because the opportunity cost of gathering 1 coconut for the two combined without specialization is 3 fish. PPC 00 Coconuts 30
Individual Abilities and Opportunity Costs In an hour, Bill could catch 1 fish or gather 1 coconut. So, the opportunity cost of having Bill gather 1 coconut is 1 fish. In an hour, Chris could catch 8 fish or gather 2 coconuts. So, the opportunity cost of having Chris gather 1 coconut is 4 fish. Bill is the low opportunity cost provider of coconuts = Bill has comparative advantage in coconuts
Island PPC with Specialization Fish 90 80 Slope = 1 (1 coconut for 1 fish for Bill) PPC Slope = 4 (4 fish for 1 coconut for Chris 00 Coconuts 10 30
What Do We Learn from this Example? There are gains from specialization when opportunity cost differs across producers and production is organized according to comparative advantage.
Gains from Specialization Fish 90 80 PPC with Specialization PPC without Specialization 00 Coconuts 10 30
Gains from Specialization Fish 90 80 PPC with Specialization PPC without Specialization Gains from Specialization 00 Coconuts 10 30
What Do We Learn from this Example? There are gains from specialization when opportunity cost differs across producers and production is organized according to comparative advantage. This explains why the PPC for a country is likely to be bowed out.
Island PPC with Specialization Fish 90 80 Slope = 1 PPC Slope = 4 00 Coconuts 10 30
What Do We Learn from this Example? There are gains from specialization when opportunity cost differs across producers and production is organized according to comparative advantage. This explains why the PPC for a country is likely to be bowed out. One determinant of the size of the gains from specialization is the difference in opportunity cost.
Gains from Specialization Fish 90 80 PPC with Specialization PPC without Specialization Gains from Specialization 00 Coconuts 10 30
Will Chris and Bill Both Benefit from Specialization? Simple Answer: As long as there is no coercion, if two parties choose to specialize and trade, both must be benefitting More complicated answer: In a market system, prices will tend to adjust to ensure that both parties gain from specialization and trade.
Quiz: Question: An economy s PPC is curved rather than linear because: A. There are trade offs B. There are only two goods C. There is specialization in production D. I don t know
Implications of the Gains from Specialization It explains why we see trade at all levels. To have trade, we need markets. Comparative advantage most obvious for agricultural products where climate is crucial (e.g. coffee grows best in tropics) or natural resources (e.g., oil in Saudi Arabia) Comparative advantage in manufacturing often based on history (e.g. cars built in the US around Detroit) but this can change overtime (e.g., cars built in China today)
Can there be too much specialization? Individual level: psychologically numbing to do very narrow tasks (e.g. assembly line). Country level: concerns about trade dependence: National security (supply side chains breakdowns, trade wars, food sufficiency, military production) Infant industries may need protection initially Environmental protection laws differ between countries Labor protection laws may differ between countries

