Scatter Diagram and Regression Line Analysis in Road Density and Fatal Accidents
Presented by Partha Modak, this analysis explores the correlation between road density and fatal accidents in various cities. By using scatter diagrams and regression lines, the study reveals a negative relationship indicating higher road density leads to increased accidents. The statistical calculations and interpretation provide insights into potential accident rates based on road density.

Download Presentation

Please find below an Image/Link to download the presentation.
The content on the website is provided AS IS for your information and personal use only. It may not be sold, licensed, or shared on other websites without obtaining consent from the author.If you encounter any issues during the download, it is possible that the publisher has removed the file from their server.
You are allowed to download the files provided on this website for personal or commercial use, subject to the condition that they are used lawfully. All files are the property of their respective owners.
The content on the website is provided AS IS for your information and personal use only. It may not be sold, licensed, or shared on other websites without obtaining consent from the author.
E N D
Presentation Transcript
Scatter Diagram and regression line Presented by Partha Modak State Aided College Teacher I Department of Geography Raghunathpur College, Purulia, W.B.
Q. The following data represent average road density and co-responding no fatal accident, from the 10 central wards of the following cities. a. Draw a scatter diagram from the data. b. Fit a trend line by least square method. c. Explain weather it is statistically possible to road density that could overate any total accident. Average no of fatal accident/ year 26 75 26 52 75 47 97 62 Average road density(sq.km) City Karachi Ahmadabad Bangalore Delhi Mumbai Chennai Kolkata Hyderabad 18 6 22 20 13 14 8 10
Worksheet for the calculation of y = a+bx Average no of fatal accident/ year (y) Average road density (x) x2 xy 18 6 22 20 13 14 8 10 x= 111 26 75 26 52 75 47 97 62 y = 460 32436 36 484 400 169 196 64 100 x2 = 1773 468 450 572 1040 975 658 776 620 xy = 5559
The two normal equation are y = na+b x xy = a x+ b x2 Putting the value from work sheet table and we get, 460= 8a+111b.....................(1) 5559=111a+ 1773b................(2) Now, equation (1) divided by 8 and equation (2) divided by 111 than we get 57.5 = a + 13.875b...............(3) _ 50.08 = _a + _15.972b...............(4) 7.42 = - 2.097b or, -2.097 = 7.42 or, b = 7.42 -2.097 or, b = -3.54
Putting the value of b in equation (3) and we get, 57.5 = a + 13.875 (- 3.54) or, 57.5 = a 49.12 or, a 49.12 = 57.5 or, a = 57.5 + 49.12 or, a = 106.62 y = a+bx = 106.62 + (-3.52 6) = 106.62 21.24 = 85.38 X y 6 14 22 85.38 57.06 28.74
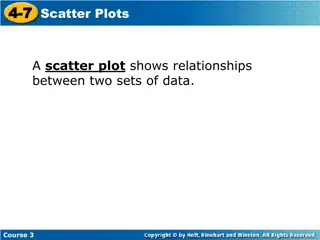
Scatter Diagram Showing the co-relation between average road density(sq/km) and average no of fatal accident Horizontal scale 1cm to 5 average road 120 Y(average no of fatal accident) Vertical scale 1cm to 20 accident 100 80 60 40 density 20 Scale 0 0 5 10 15 20 25 X (average road density sq/km)
Interpretation: According to the data, we have been draw the above scatter diagram, by the help of this diagram, we have try to established the inter relation between average road density and average no of fatal accident. Here we can easily see that, the scatter point and the location of the regression line situated in negative relation. That s mean if the road density will be increase than no vehicle and traffic will also increase and then the chances of accident normally increase. On the other side if road density will decrease, there for the traffic will be face the same problem and chances of accident will be increase.


 and we get,")