Scatterplot Creation and Understanding Relationships in Statistics
Learn how to create a scatterplot by entering data in L1 and L2, distinguish between explanatory and response variables, describe relationships using D.U.F.S method, understand the correlation coefficient, and interpret the strength and direction of a linear relationship. Gain insights into the essential concepts of scatterplots and analyzing quantitative data relationships.

Download Presentation

Please find below an Image/Link to download the presentation.
The content on the website is provided AS IS for your information and personal use only. It may not be sold, licensed, or shared on other websites without obtaining consent from the author. If you encounter any issues during the download, it is possible that the publisher has removed the file from their server.
You are allowed to download the files provided on this website for personal or commercial use, subject to the condition that they are used lawfully. All files are the property of their respective owners.
The content on the website is provided AS IS for your information and personal use only. It may not be sold, licensed, or shared on other websites without obtaining consent from the author.
E N D
Presentation Transcript
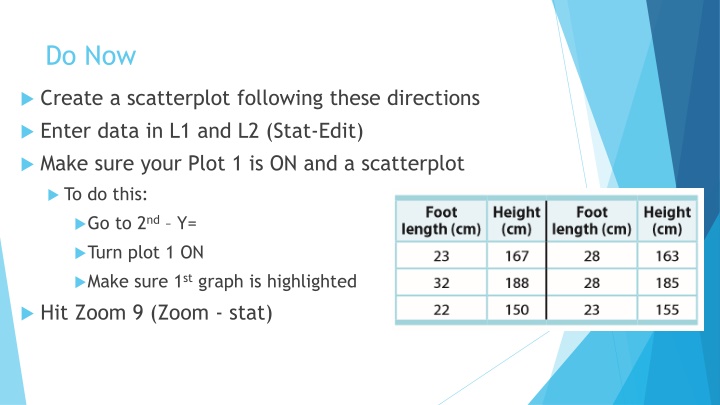
Do Now Create a scatterplot following these directions Enter data in L1 and L2 (Stat-Edit) Make sure your Plot 1 is ON and a scatterplot To do this: Go to 2nd Y= Turn plot 1 ON Make sure 1stgraph is highlighted Hit Zoom 9 (Zoom - stat)
Lesson 3.1: Scatterplots and Describing a Relationship
Objectives Distinguish between explanatory and response variables for quantitative data. Make a scatterplot to display the relationship between two quantitative variables Describe the direction, form, and strength of a relationship displayed in a scatterplot and identify unusual features.
A response variable measures an outcome of a study. An explanatory variable may help predict or explain changes in a response variable.
Important Ideas Explanatory- always on x axis (horizontal) Response always on y axis (vertical) D.U.F.S Direction Unusual Features or outliers Form Strength
Do now- Describe the following relationships using D.U.F.S
Correlation Coefficient The correlation r is a measure of the strength and direction of a linear relationship between two quantitative variables. The correlation r is a value between -1 and 1 (-1 r 1). If the relationship is negative, then r < 0. If the relationship is positive, then r > 0. If r =1 or r = -1, then there is a perfect linear relationship. In other words, all of the points will be exactly on a line. If there is very little scatter from the linear form, then r is close to 1 or -1. The more scatter from the linear form, the closer r is to 0.
To Calculate r. 1. Hit 2nd0 (Brings us to CATALOG) 2. Scroll alllllll the way down to DiagnosticON need to do this once, unless your calculator is reset or you use a different one) 3. Hit enter 4. And enter again. Should say Done 5. Enter data into L1 and L2 (Stat-Edit) 6. Then Stat-Calc LinReg (a+bx) This is #8, not #4 7. r is your correlation coefficient! (you only
Do now Finish the front page of lesson 3.1 day 2 handout