Scenarios and Projections for COVID-19 in Arizona:
This presentation provides insights into the COVID-19 situation in Arizona, including updates, projections, and recommendations for re-opening businesses safely. Expert analysis from Timothy Lant, a mathematical epidemiologist, sheds light on key policy drivers affecting the pandemic situation in the state.

Download Presentation

Please find below an Image/Link to download the presentation.
The content on the website is provided AS IS for your information and personal use only. It may not be sold, licensed, or shared on other websites without obtaining consent from the author.If you encounter any issues during the download, it is possible that the publisher has removed the file from their server.
You are allowed to download the files provided on this website for personal or commercial use, subject to the condition that they are used lawfully. All files are the property of their respective owners.
The content on the website is provided AS IS for your information and personal use only. It may not be sold, licensed, or shared on other websites without obtaining consent from the author.
E N D
Presentation Transcript
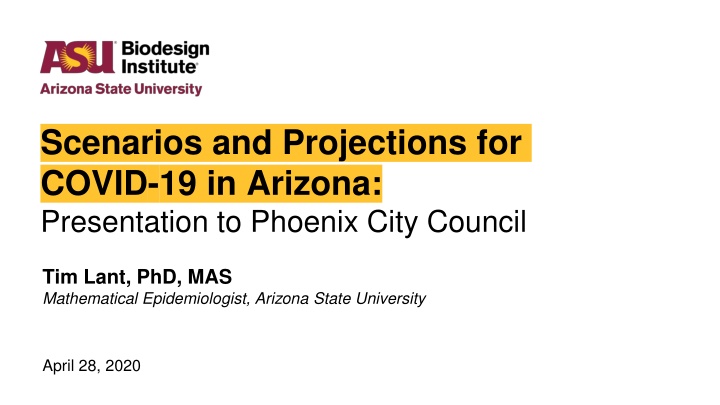
Scenarios and Projections for COVID-19 in Arizona: Presentation to Phoenix City Council Tim Lant, PhD, MAS Mathematical Epidemiologist, Arizona State University April 28, 2020
About the author Timothy Lant, PhD, MAS Expert in pandemic modeling and response Ph.D. Mathematics from ASU Led the USG Department of Health and Human Services epidemic modeling team from 2012 2017 Leading COVID-19 Modeling Task Force for ASU 22 years in Phoenix metro area Extrovert Loves sports, concerts, restaurants, theater, and festivals Lived in DC, GA, TN, CA, MA, FL, MI, IL, NC, MD, and AZ
AZ COVID-19 Situation Update: 4/27 We are continuing to see an increase in cases and more testing. Phases to Opening Up America Again: We are at day 3 of 14. Soonest day to consider transitioning to Phase I is May 11. Increased intensity of social-distancing measures 3/17, 3/21, and 3/31 show that Arizona policies to close businesses decreased the rate of hospitalization/deaths. Key policy drivers are now: public safety, under-reporting/testing, severity of disease, and potential summer effects.
April 27, 2020 Situation Update We receive daily data-sets from ADHS as part of modeling WG We update forecasts from ADHS and commercial lab testing data, hospitalization data, and experience of other states/countries Monitor testing data and public health interventions as the basis of estimates
April 27, 2020 Situation Update Daily COVID-19 Positive Tests 350 300 250 200 150 100 50 0 3/4/20 3/11/20 3/18/20 3/25/20 4/1/20 4/8/20 4/15/20 4/22/20 5 day average 3 day average Daily Incidence
Question: Is it safe to re-open businesses in Arizona? When will it be?
Answer: Use policy directives to keep the new case count controlled for 14 days. Protect the healthcare system to ensure appropriate care. Avoid surge. Treat patients without crisis care.
The Iceberg of Disease Severity The top of the pyramid implies significant healthcare resource requirements. Public health policies can aim to prevent the bottom of the pyramid from growing. DEATHS:1.61% 2 Weeks VENTILATOR: 6.45% IN ICU: 7.34% There is a two-week delay. TOTAL HOSPITALIZED CASES: 16.3% TOTAL SYMPTOMATIC BUT NONHOSPITALIZED CASES: 65.2% TOTAL ASYMPTOMATIC CASES: 18.5%
Epidemiology Signal 14 days Arizona COVID-19 Testing Growth has slowed 7000 4/26: Still increasing at approximately linear growth 6000 Low hundreds of cases per day 5000 4/8: Growth is slowing down. 3/16 limited gatherings; 3/20 bars and restraurants close; 3/31 stay-at-home. Policies are clearly working 4000 Does not include undetected cases 3000 2000 1000 0 3/4/20 3/6/20 3/8/20 4/1/20 4/3/20 4/5/20 4/7/20 4/9/20 3/10/20 3/12/20 3/14/20 3/16/20 3/18/20 3/20/20 3/22/20 3/24/20 3/26/20 3/28/20 3/30/20 4/11/20 4/13/20 4/15/20 4/17/20 4/19/20 4/21/20 4/23/20 4/25/20 Positive Deaths
Downward Trajectory of Cases in Last 14 Days? Criteria: Daily COVID-19 Positive Tests - 14 Day Prior Experience 350 1. Lowest daily case rate in 14 days? NO 14 days 1 300 2 3 250 200 1. Days since peak? 3 150 100 The soonest AZ will reach the 14 day criteria is May 11. 50 0 4/13/20 4/14/20 4/15/20 4/16/20 4/17/20 4/18/20 4/19/20 4/20/20 4/21/20 4/22/20 4/23/20 4/24/20 4/25/20 4/26/20 Daily Incidence 5 day average 3 day average
Downward Trajectory of proportion of positive tests? Rolling weekly positive COVID-19 test rate 8000 0.8 14 days We are continuing to see an increase in cases and increase in testing. 4/20: Positive test rate has increased steadily over time to over 12% indicating higher burden of COVID-19 disease in population. If Arizona were well past the peak, this would fall quickly. 7000 0.7 6000 0.6 5000 0.5 The proportion of positive tests is increasing. (Red Line) 4000 0.4 3000 0.3 2000 0.2 We want to see a decrease in cases, an increase in testing, and a decrease in proportion of positive tests. 1000 0.1 0 0 4/1/20 4/3/20 4/5/20 4/7/20 4/9/20 3/10/20 3/12/20 3/14/20 3/16/20 3/18/20 3/20/20 3/22/20 3/24/20 3/26/20 3/28/20 3/30/20 4/11/20 4/13/20 4/15/20 4/17/20 4/19/20 4/21/20 4/23/20 4/25/20 Tests Positive %
Bending the curve is measurably working and remains in effect 14 days AZ confirmed cases - log scale This graph shows the rate of growth of new COVID-19 cases in Arizona. 9 8 Early contact based spread. Limited transmission and contact tracing. Beginnings of community infection. 7 effect 6 Reduced transmission due (hopefully) to social distancing and increased testing. There is a distinct bend in the curve around 3/27 and continued reduction 5 cause 4 3 Undetected disease transmission, sustained community spread, and cases increase in severity. 2 Policies have an effect 1 - 2 weeks after implementation 1 0 3/7/20 3/8/20 3/9/20 4/1/20 4/2/20 4/3/20 4/4/20 4/5/20 4/6/20 4/7/20 4/8/20 4/9/20 3/10/20 3/11/20 3/12/20 3/13/20 3/14/20 3/15/20 3/16/20 3/17/20 3/18/20 3/19/20 3/20/20 3/21/20 3/22/20 3/23/20 3/24/20 3/25/20 3/26/20 3/27/20 3/28/20 3/29/20 3/30/20 3/31/20 4/10/20 4/11/20 4/12/20 4/13/20 4/14/20 4/15/20 4/16/20 4/17/20 4/18/20 4/19/20 4/20/20
Scenarios and projections We considered five scenarios to provide a range of projections on: Total number infected includes asymptomatic and pre-symptomatic Hospitalized patients Patients in an ICU Patients on a ventilator We ran three excursion scenarios to look at: What happens if we re-open too quickly What conditions are required when we do re-open - - - - - -
Scenarios: Scenario Description Best case scenario. Assumes high effective social distancing with an low effective transmission rate (beta = 0.15). Assumes that asymptomatic transmission is negligible with a 1X unconfirmed multiple. A beneficial Summer effect is modeled by reducing beta by half (to 0.075) on May 1. Scenario 1 Scenario 2 Moderate transmission; no underreporting. Assumes continued social distancing with moderate compliance (beta = 0.25) Summer effect is modeled by reducing beta by half on May 15. Scenario 3 Best fit: Assumes undetected cases are 4X known cases and can transmit asymptomatically (beta = .20). Summer effect is modeled by reducing S by half on May 15. Assumes no additional mitigation, but high compliance with current social distancing orders. This scenario is the current best fit to the data. Scenario 4 Limited re-opening scenario. Limited asymptomatic transmission, limited re-opening. This scenario assumes a slightly increased transmission consistent with limited re-opening and congregation of small groups(beta = 0.25). Assumes 4X undetected cases as initial infections. Summer effect is modeled by reducing S by half on May 15. Same as scenario 3 with increased transmission. Late testing scenario: Assumes a high number of infectious, undetected cases (11X) that would be consistent with rolling out testing in the middle of a large outbreak (similar to Wuhan or Italy). Current social distancing (beta =0.2). Summer effect of reduced transmission rate, beta to 0.10 after May 15. Scenario 5
Protecting Healthcare: Total Infected Total infected Includes asymptomatic who may be transmitting the disease Summer effect Assumes May 15 for reduction in transmission Summer effects not yet known Confirmed Infected Cases 45000 - 40000 35000 30000 25000 20000 - 15000 10000 - 5000 0 5/1/20 5/4/20 5/7/20 6/3/20 6/6/20 6/9/20 7/3/20 7/6/20 7/9/20 Date 4/10/20 4/13/20 4/16/20 4/19/20 4/22/20 4/25/20 4/28/20 5/10/20 5/13/20 5/16/20 5/19/20 5/22/20 5/25/20 5/28/20 5/31/20 6/12/20 6/15/20 6/18/20 6/21/20 6/24/20 6/27/20 6/30/20 7/12/20 7/15/20 7/18/20 7/21/20 7/24/20 7/27/20 7/30/20 Scenario1 Scenario 2 Scenario 3 Scenario 4 Scenario 5
Protecting Healthcare: Patients A portion of the hospitalized infections are in the ICU, which we track separately due to the significant resources need to care for ICU patients. Hospitalizations by scenario 1400 1200 1000 800 600 400 ICU care requires a specialized healthcare workforce. 200 0 1 4 7 10 13 16 19 22 25 28 31 34 37 40 43 46 49 52 55 58 61 64 67 70 73 76 79 82 85 88 91 94 97 100 103 106 109 112 115 Scenario1 Scenario 2 Scenario 3 Scenario 4 Scenario 5
Protecting Healthcare: Patients in ICU ICU resources are critical to save lives. ICU - All scenarios 700 600 In particular, several sources have pointed to longer ICU stays by patients that eventually recover. 500 400 300 200 ICU stays can be as long as 14+ days for these patients. 100 0 5/1/20 5/4/20 5/7/20 6/3/20 6/6/20 6/9/20 7/3/20 7/6/20 7/9/20 Date 4/10/20 4/13/20 4/16/20 4/19/20 4/22/20 4/25/20 4/28/20 5/10/20 5/13/20 5/16/20 5/19/20 5/22/20 5/25/20 5/28/20 5/31/20 6/12/20 6/15/20 6/18/20 6/21/20 6/24/20 6/27/20 6/30/20 7/12/20 7/15/20 7/18/20 7/21/20 7/24/20 7/27/20 7/30/20 Scenario1 Scenario 2 Scenario 3 Scenario 4 Scenario 5
Excursions: What is the effect of re-opening Scenario Description Slow re-opening. Assumes continued social distancing with a low effective transmission rate (beta = 0.15) until May 1. On May 15, beta increases to low 0.20 to reflect re-opening, slightly higher than current transmission. Assumes a 4X multiple for undetected transmission. No summer effect. Excursion 1 Excursion 2 Moderate re-opening. Assumes continued social distancing with a low effective transmission rate (beta = 0.15) until May 1. On May 15, beta increases to moderate 0.25 to reflect re-opening, similar to estimates for beta during the initial restrictions. Assumes a 4X multiple for undetected transmission. No summer effect. Scenario 3 Best fit: Assumes undetected cases are 4X known cases and can transmit asymptomatically (beta = .20). Summer effect is modeled by reducing S by half on May 15. Assumes no additional mitigation, but high compliance with current social distancing orders. This scenario is the current best fit to the data. Scenario 4 Limited re-opening scenario with summer effect. Limited asymptomatic transmission, limited re-opening. This scenario assumes a slightly increased transmission consistent with limited re-opening and congregation of small groups(beta = 0.25). Assumes 4X undetected cases as initial infections. Summer effect is modeled by reducing beta by half on May 15. Same as scenario 3 with increased transmission. Fast re-opening. Assumes continued social distancing with a low effective transmission rate (beta = 0.15) until May 1. On May 1, beta increases to high 0.30 to reflect re-opening, similar to estimates for beta prior to closures. Assumes a 4X multiple for undetected transmission. No summer effect. Excursion 5
Re-opening Excursions Confirmed Infected Cases 100000 Slow: June 1 beta = 0.20 90000 Moderate: May 15 beta = 0.25 80000 70000 Fast: May 1 beta = 0.30 60000 50000 40000 30000 20000 10000 0 4/9/20 5/1/20 5/3/20 5/5/20 5/7/20 5/9/20 6/2/20 6/4/20 6/6/20 6/8/20 7/2/20 7/4/20 7/6/20 7/8/20 Date 4/11/20 4/13/20 4/15/20 4/17/20 4/19/20 4/21/20 4/23/20 4/25/20 4/27/20 4/29/20 5/11/20 5/13/20 5/15/20 5/17/20 5/19/20 5/21/20 5/23/20 5/25/20 5/27/20 5/29/20 5/31/20 6/10/20 6/12/20 6/14/20 6/16/20 6/18/20 6/20/20 6/22/20 6/24/20 6/26/20 6/28/20 6/30/20 7/10/20 7/12/20 7/14/20 7/16/20 7/18/20 7/20/20 7/22/20 7/24/20 7/26/20 7/28/20 7/30/20 Scenario1 Scenario 2 Scenario 3 Scenario 4 Scenario 5
Question: When can we re-open AZ and what needs to be done? 1. Keep new case count as low as possible Social distancing Test Trace Isolate 2. Open up gradually and carefully Follow White House plan to open up gradually Avoid costly intermittent re-opening Monitor closely policies and their effect on future COVID cases
This is unlike other disasters - hurricanes, earthquakes, floods. They happen, they're fast, they're over, you start rebuilding...This is ongoing & the duration itself is debilitating & exhausting & depressing. -New York Governor Cuomo