School Discipline and Crime Reporting Workshop
Explore the 2014-2015 annual report on discipline, crime, and violence in schools, highlighting incident reporting requirements, offenses coding, and data organization. Learn about the importance of accurate reporting and caution when analyzing trends. Dive into a comprehensive overview of incidents, offenders, and disciplinary actions from 2010-2015.

Uploaded on | 1 Views
Download Presentation

Please find below an Image/Link to download the presentation.
The content on the website is provided AS IS for your information and personal use only. It may not be sold, licensed, or shared on other websites without obtaining consent from the author. If you encounter any issues during the download, it is possible that the publisher has removed the file from their server.
You are allowed to download the files provided on this website for personal or commercial use, subject to the condition that they are used lawfully. All files are the property of their respective owners.
The content on the website is provided AS IS for your information and personal use only. It may not be sold, licensed, or shared on other websites without obtaining consent from the author.
E N D
Presentation Transcript
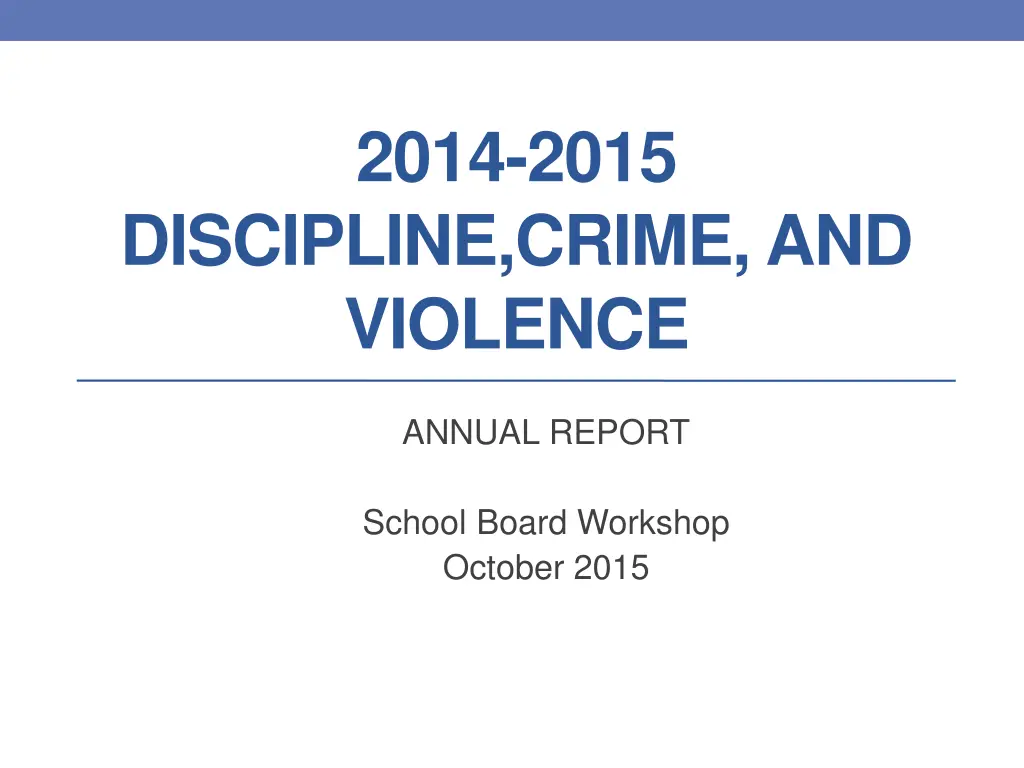
2014-2015 DISCIPLINE,CRIME, AND VIOLENCE ANNUAL REPORT School Board Workshop October 2015
2 Incident Reporting All reporting is incident based Some incidents must be reported regardless of sanctions Some incidents must be reported only if it results in suspension/expulsion School related incidents occurring on school property/events/activities regardless of time or day (365 days a year/24 hours a day/7 days a week).
3 REPORTING REQUIREMENTS Required Regardless of Sanction Required if Sanction is Suspension or Expulsion Attendance violations Electronic devices, use of Disorderly conduct (minor disruption)/insubordination Drug violations for over-the-counter medications Altercation Gambling Hazing Other violations Tobacco paraphernalia Violation of technology use Weapon look-alike /Possible weapons (razor blades, box cutters, stink bombs, firecrackers, etc. etc.) Homicide Kidnapping Inciting a riot Stalking Sexual battery Sexual harass Theft Tobacco use, possession, sale, or distribution Threat or intimidation Trespassing Vandalism Alcohol Assault/battery Malicious wounding School threat Breaking and entering Bullying Disorderly conduct (major disruption) Drug violations Extortion Fighting, regardless of level of injury Gang activity
4 How are offenses coded? It is the responsibility of the school administrator to determine the offense code that is reported, based on the offense definition. SB Policies and administrator judgment can also influence what offense code is reported. For example A first grader shoving another first grader on the playground may result in only a verbal reprimand and would not be required to be reported to the VDOE. A tenth grader shoving another tenth grader in the hallway during a change of classes may be deemed to be disorderly conduct, altercation, or even an assault, depending on the circumstances.
5 A Word of Caution Be cautious when analyzing trends and making comparisons between one school with another, or one year with another WHY? Administrators do not always code the same behavior in exactly the same way. Reporting requirements may change from year to year. There is usually a story behind the numbers.
6 Organization of Data I. 5-Year Division Overview (2010-2015) Incidents Offenders Disciplinary Actions II. 2014-2015 Data Snapshot Elementary Middle High Alternative Programs
INCIDENTS Violations of the Student Code of Conduct are reported as incidents. An incident is an event that may involve : 1. one or more offenses. 2. one or more students. 3. one or more disciplinary outcomes
8 2010-2015 DIVISION OVERVIEW Chart 1: Total Number of Incidents by Year 9500 9000 INCIDENT COUNT 8500 8000 7500 7000 SY 10-11 9074 SY 11-12 8553 SY 12-13 8335 SY 13-14 7991 SY 14-15 7776 Series1 12835 13014 15392 15658 15801
9 2010-2015 DIVISION OVERVIEW Chart 2: Total Number of Incidents by SSIR Category Incident Count Unduplicated 7000 6000 5000 4000 3000 2000 1000 0 01_Weapon s 62 82 106 77 73 02_Off. Vs Stu. 312 306 248 248 138 03_Off. Vs. Staff 156 144 140 90 73 04_Off. Vs. Persons 1327 1106 1259 1246 1190 06_Prop. Off. 209 170 161 160 118 07_Dis./Disr up. Beh. 6135 5901 5349 5223 5297 08_Tech. Off. 229 262 204 199 166 09_Other Off. 573 473 784 670 625 05_ATOD SY 10-11 SY 11-12 SY 12-13 SY 13-14 SY 14-15 71 109 84 78 96
10 Chart 3: Percentage of Incidents by Category 02_Off. Vs Stu. 3% SY 12-13 09_Other Off. 5% SY 11-12 03_Off. Vs. Staff 2% 09_Other Off. 9% 01_Weapons 1% 01_Weapons 1% 03_Off. Vs. Staff 2% 08_Tech. Off. 3% 02_Off. Vs Stu. 4% 08_Tech. Off. 3% 04_Off. Vs. Persons 15% 04_Off. Vs. Persons 13% 05_ATOD 1% 06_Prop. Off. 2% 05_ATOD 1% 06_Prop. Off. 2% 07_Dis./Disru p. Beh. 64% 07_Dis./Disru p. Beh. 69% 02_Off. Vs Stu. 2% SY 14-15 09_Other Off. 8% 02_Off. Vs Stu. 3% 03_Off. Vs. Staff 1% SY 13-14 01_Weapons 1% 08_Tech. Off. 2% 01_Weapons 1% 03_Off. Vs. Staff 1% 09_Other Off. 8% 08_Tech. Off. 3% 04_Off. Vs. Persons 15% 04_Off. Vs. Persons 16% 05_ATOD 1% 05_ATOD 1% 06_Prop. Off. 2% 06_Prop. Off. 2% 07_Dis./Disru p. Beh. 68% 07_Dis./Disru p. Beh. 65%
OFFENDERS Unduplicated counts of individuals engaging in at least one offense.
12 2010- 2015 DIVISION OVERVIEW Chart 4: Offenders by Year 3600 3500 3400 3300 Offender Count 3200 3100 3000 2900 2800 2700 SY 10-11 3550 SY 11-12 3255 SY 12-13 3156 SY 13-14 3087 SY 14-15 3035 OFFENDERS
13 2010-2015 DIVISION OVERVIEW Chart 5: Total Number of Offenders by Race/Ethnicity 4000 3500 3000 # of OFFENDERS 2500 2000 1500 1000 500 0 ALL OFFENDERS 3550 3255 3156 3087 3035 BLK OFFENDERS 2094 1931 1907 1846 1805 WHT OFFENDERS 1096 985 928 921 898 HIS OFFENDERS 150 142 151 163 174 MULT OFFENDERS SY 10-11 SY 11-12 SY 12-13 SY 13-14 SY 14-15 137 139 122 115
14 2010-2015 DIVISION OVERVIEW Chart 8: Offenders by Select Subgroups 14000 12000 10000 # of Offenders 8000 6000 4000 2000 0 Disadvantaged offenders 3061 2881 2860 2793 2575 Disadvantaged Enrolled 9031 11431 11231 11301 10450 IEP/504 Offenders 592 613 554 660 667 IEP/504 Enrolled 2102 2328 2077 2380 2396 LEP Offenders LEP Enrolled SY 10-11 SY 11-12 SY 12-13 SY 13-14 SY 13-14 186 183 174 195 192 1239 1253 1371 1452 1391
15 2014-2015 Data Snapshot Chart 9: Offenders by Race and Gender ASIAN_F 1% ASIAN_M 2% Enrolled MULTI_F 2% % of ALL OFFENDERS % OF GROUP ENROLLMENT ENROLLEMENT OFFENDERS HIS_F 5% BLK_M 22% ASIAN_M 248 26 <1% 10% WHT_F 19% BLK_M 3511 1152 38% 33% WHT_M 21% BLK_F 21% WHT_M 3318 623 21% 19% HIS_M 804 117 4% 15% MULTI_M 2% HIS_M 5% MULTI_M 259 76 3% 29% Offenders MULTI_F 1% ASIAN_M 1% HIS_F 2% BLK_F 3324 653 22% 20% ASIAN_F 0% WHT_F 9% WHT_F 3018 275 9% 9% HIS_F 778 57 7% 7% BLK_M 38% BLK_F 22% MULTI_F 288 39 1% 14% ASIAN_F 214 10 <1% 5% MULTI_M 2% WHT_M 21% HIS_M 4% OFFENDERS 15762 3028
16 2014-2015 Data Snapshot Chart 10: Offenders by School Level FPA 2% NCTLA 2% 3,122 offenders including 85 students who offended at multiple sites. HIGH 31% ELEMENTARY 35% 3,035 Offenders unduplicated MIDDLE 30% Note: This table includes 85 students who are represented twice in the table. They were involved in incidents at two separate sites.
17 2014-2015 Data Snapshot Chart 11: Offenders by Disability Category 504 PLAN 12% OHI 19% SPEECH OR LANGUAGE 6% AUTISM 6% EMOTIONAL D 12% DEVELOPMENTAL 2% INTELLECTUAL 7% MULTIPLE 0% VISUAL I 0% SPECIFIC LD 35% HEARING 1%
DISCIPLINARY OUTCOMES Sanction imposed on a student for his/her misconduct. Types of outcomes reported are short-term suspension, long-term suspension, expulsion, modified expulsion, other sanctions, and special education interim placement.
19 2010-2015 DIVISION OVERVIEW Chart 12: Offenders with Out-of-School Suspension by Year 2000 1800 1600 1400 1200 Unduplicated Offender count 1000 800 600 400 200 0 SY 2010-11 1754 SY 2011-12 1818 SY 2012-13 1541 SY 2013-14 1505 SY 2014-15 1544 OSS by Year
20 2010-2015 DIVISION OVERVIEW Chart 13: Unduplicated Offenders with Out of School Suspension by Offender Race 1400 1200 . 1000 Student Count 800 600 400 200 0 HISPANIC 72 71 54 58 74 BLACK 1102 1164 992 993 1003 WHITE 500 503 426 399 408 MULTI 80 80 69 55 59 SY 2010-11 SY 2011-12 SY 2012-13 SY 2013-14 SY 2014-15
21 2010-2015 DIVISION OVERVIEW Chart 14: Offenders with Police Referrals by Year 1000 900 800 700 600 Offender Count 500 400 300 200 100 0 SY 2010-11 801 SY 2011-12 865 SY 2012-13 815 SY 2013-14 609 SY 2014-15 526 POLICE REFERRAL *Offenders can be duplicated if out of school suspension or police involvement occurred at different school; otherwise each offender is counted once.
22 2010-2015 DIVISION OVERVIEW Chart 15: Offenders with Police Referrals by Race 1000 900 800 Offenders with Police Referral 700 600 500 400 300 200 100 0 HISPANIC 31 34 19 25 22 BLACK 485 545 509 402 324 WHITE 234 249 242 155 155 MULTI 51 37 45 27 24 TOTAL 801 865 815 609 525 2010-2011 2011-2012 2012-2013 2013-2014 2014-2015
23 2014-2015 Data Snapshot Disciplinary Outcomes Chart 16:Group Comparison of OSS by Race % of OFFENDERS Receiving OSS % of Subgroup POPULATION Receiving OSS by Race BLACK 15% BLACK 56% WHITE 6.4% WHITE 45% HISPAN 5% HISPAN MULTI 43% MULTI 11% 51%
24 2014-2015 Data Snapshot Disciplinary Outcomes Chart 17: Group Comparison of Police Referrals by Race % of OFFENDERS Referred to Police % of Subgroup POPULATION Referred to Police BLACK 18% BLACK 5% WHITE 6.4% WHITE 2% HISPAN 5% HISPAN 1% MULTI 11% MULTI 4.6%
25 2014-2015 Data Snapshot Disciplinary Outcomes Chart 18: Percentage of Disciplinary Outcomes by SSIR Category 04_TO 3% 01_Weapons 02_Off. Vs Stu. 05_DRC 3% 05_DRC 1% 03_LBP 2% 03_LBP 7% 04_TO 11% 02_ISS 15% 02_ISS 17% 01_OSS 77% 01_OSS 64% 04_Off. Vs. Persons 03_Off. Vs. Staff 05_DRC 0% 05_DRC 6% 04_TO 1% 02_ISS 7% 04_TO 10% 03_LBP 11% 01_OSS 58% 02_ISS 21% 01_OSS 86%
26 2014-2015 Data Snapshot Disciplinary Outcomes Chart 18: Percentage of Disciplinary Outcomes by SSIR Category ALT 1% 05_ATOD 06_Prop. Off. HRG 1% 06-SBH 0% 05_DRC 5% 03_LBP 3% 04_TO 14% 02_ISS 13% 01_OSS 49% 02_ISS 34% 01_OSS 80% 08_Tech. Off. 07_Dis./Disrup. Beh. 04_TO 6% 05_DRC 0% 03_LBP 6% 04_TO 12% 01_OSS 30% 01_OSS 40% 02_ISS 64% 02_ISS 42%
27 2014-2015 Data Snapshot Disciplinary Outcomes Chart 18: Percentage of Disciplinary Outcomes by SSIR Category 09_Other Off. 05_DRC 0% 04_TO 8% 01_OSS 12% 03_LBP 8% 02_ISS 72%
28 DATA TAKEAWAYS INCIDENTS The number of incidents have steadily declined over the last 5 years. Significant reduction in incidents involving offenses against students (bullying, assault/battery, theft) 68% of Incidents are for disrespect/defiance and disruptive behavior. OFFENDERS 7% decrease in offenders from previous 5-year average 2% decrease in incidents from previous year 85% of Offenders are disadvantaged. Black males make up the largest portion of the offenders (38%) followed by Black females (22%) and white males (21%). DISCIPLINARY ACTION 43% of incidents result in OSS (the most often used disciplinary action reported). Police referrals have been declining steadily over the last 3-years A discipline gap exists between Black/multi-race students and their white peers. However, RCPS is proactively addressing the issue.
29 HOW RCPS IS CLOSING THE DISCIPLINE GAP Develop and implement a clear , universal definition of disrespect/defiance Division-wide implementation of: i. Progressive Level System (Developed in 2013; added to SCC 2014) ii. Suspension Criteria Checklist (Developed 2014) iii. Positive Behavioral Supports and Interventions iv. Restorative Practices V. Bulling Investigation Protocols Collect and Disaggregate data to address disproportionality in suspensions and law enforcement referrals. 2015-2016 will be the baseline year. Monitor school climate/analyze school climate data. Monitor suspensions and law enforcement referrals weekly. Address Classroom Management needs of teachers Mental Health First Aide/ Classroom Management Strategies/De- Escalation
30 HOW RCPS IS CLOSING THE DISCIPLINE GAP Ensure that all principals are equipped with the tools to maintain safety and order. Administrator s Resource Manual/Toolkit (Developed 2015) Appropriate use of law enforcement Leadership for School Safety and Effective Discipline Series (Implemented in 2014) Provide alternatives to suspension (Counseling, Restorative Justice, Restitution, PBIS )
31 QUESTIONS?
32 ELEMENTARY SCHOOLS
33 2014-2015 Elementary School Data Snapshot Chart 19: Elementary School Incidents by Year 3500 3000 2500 2000 Axis Title 1500 1000 500 0 SY 10-11 2994 SY 11-12 2505 SY 12-13 2950 SY 13-14 2881 SY 14-15 2314 Series1
34 2010-2015 Incidents by Elementary School Chart 21: Elementary Incidents by School FAIRVIEW CRYSTAL 500 35 30 400 INCIDENTS INCIDENTS 25 20 300 15 200 10 5 100 0 SY 10-11 24 SY 11-12 26 SY 12-13 30 SY 13-14 18 SY 14-15 12 0 CRYS SY 10-11 444 SY 11-12 348 SY 12-13 202 SY 13-14 283 SY 14-15 291 FAIR FISHBURN FALLON 90 600 80 500 70 INCIDENTS INCIDENTS 60 400 50 300 40 30 200 20 100 10 0 0 SY 10- 11 53 SY 11- 12 49 SY 12- 13 78 SY 13- 14 84 SY 14- 15 60 SY 10-11 477 SY 11-12 398 SY 12-13 397 SY 13-14 478 SY 14-15 345 Fallon FISH
35 2010-2015 Incidents by Elementary School Chart 21: Elementary Incidents by School GRANDIN GARDEN 250 300 200 250 INCIDENTS INCIDENTS 200 150 150 100 100 50 50 0 SY 10- 11 203 SY 11- 12 189 SY 12- 13 249 SY 13- 14 197 SY 14- 15 136 0 SY 10-11 215 SY 11-12 118 SY 12-13 48 SY 13-14 68 SY 14-15 74 GARD GRAN HIGHLAND HURT 140 500 120 450 100 400 INCIDENTS 350 80 INCIDENTS 300 60 HURT, 266 250 40 200 150 20 100 0 50 SY 10-11 116 SY 11-12 116 SY 12-13 39 SY 13-14 73 SY 14-15 64 HIGH 0 SY 10-11 SY 11-12 SY 12-13 SY 13-14 SY 14-15
36 2010-2015 Incidents by Elementary School Chart 21: Elementary Incidents by School LINCOLN MONTEREY 250 100 90 80 200 INCIDENTS 70 INCIDENTS 60 150 50 40 100 30 20 50 10 0 0 SY 10-11 65 SY 11-12 76 SY 12-13 91 SY 13-14 89 SY 14-15 54 SY 10-11 147 SY 11-12 213 SY 12-13 222 SY 13-14 116 SY 14-15 99 MONT LINC PRESTON MORNINGSIDE 160 160 140 INCIDENTS 140 120 120 100 INCIDENTS 100 80 80 60 40 60 20 40 0 20 SY 10- 11 69 SY 11- 12 75 SY 12- 13 98 SY 13- 14 110 SY 14- 15 136 0 SY 10-11 110 SY 11-12 112 SY 12-13 40 SY 13-14 77 SY 14-15 139 PRES MORN
37 2010-2015 Incidents by Elementary School Chart 21: Elementary Incidents by School ROUNDHILL ROANOKE ACADEMY 800 350 700 300 600 INCIDENTS 250 INCIDENTS 500 200 400 150 300 100 200 50 100 0 SY 10- 11 288 VIRGINIA HEIGHTS SY 11- 12 147 SY 12- 13 141 SY 13- 14 180 SY 14- 15 171 0 SY 10-11 195 SY 11-12 130 WASENA SY 12-13 672 SY 13-14 471 SY 14-15 187 RAMS ROUN 100 150 90 80 145 INCIDENTS 70 140 60 INCIDENTS 50 135 40 30 130 20 10 125 0 SY 10- 11 25 SY 11- 12 86 SY 12- 13 63 SY 13- 14 34 SY 14- 15 26 120 VIRG 115 SY 10-11 141 SY 11-12 128 SY 12-13 145 SY 13-14 126 SY 14-15 126 WASE
38 2010-2015 Incidents by Elementary School Chart 21: Elementary Incidents by School WESTSIDE 300 250 INCIDENTS 200 150 e 100 50 0 SY 10- 11 248 SY 11- 12 118 SY 12- 13 65 SY 13- 14 44 SY 14- 15 128 WEST
39 MIDDLE SCHOOLS
40 2010-2015 Middle School Overview Chart 25: Middle School Incidents by Year 3500 3000 2500 2000 Incidents 1500 1000 500 0 SY 10-11 3089 SY 11-12 3226 SY 12-13 2655 SY 13-14 2515 SY 14-15 2502 Total Incidents
41 2010-2015 Incidents by Middle School Chart 27: Incidents by Year ADDISON BRECKINRIDGE 580 576 800 570 724 700 562 560 656 611 600 561 550 512 500 540 540 400 530 530 526 300 520 200 510 100 500 SY 10-11 SY 11-12 SY 12-13 SY 13-14 SY 14-15 0 SY 10-11 SY 11-12 SY 12-13 MADISON SY 13-14 SY 14-15 JACKSON 800 800 747 743 700 700 600 600 602 568 500 500 484 472 400 434 360 400 300 280 300 242 200 200 100 100 0 SY 10-11 SY 11-12 SY 12-13 SY 13-14 SY 14-15 0 SY 10-11 SY 11-12 SY 12-13 SY 13-14 SY 14-15
42 2010-2015 Incidents by Middle School Chart 27: Incidents by Year WILSON 900 837 809 800 700 686 600 500 465 460 400 300 200 100 0 SY 10-11 SY 11-12 SY 12-13 SY 13-14 SY 14-15
43 2010-2015 MIDDLE SCHOOL OVERVIEW Chart 30A: Offenders Receiving OSS 560 550 540 530 Offender Count e 520 510 500 490 480 470 SY 2010-11 543 SY2011-12 550 SY 2012-13 530 SY 2013-14 503 SY 2014-15 530 #REF!
44 2010-2015 MIDDLE SCHOOL OVERVIEW Chart 30B: Offenders Referred to Law Enforcement 20 18 16 14 12 Offenders 10 8 6 4 2 0 SY 2010-11 18 SY2011-12 13 SY 2012-13 13 SY 2013-14 13 SY 2014-15 14 Series1
45 HIGH SCHOOLS
46 2010-2015 High School Overview Chart 31: Incidents by Year 2900 2800 2700 2600 Incident Count 2500 2400 2300 2200 2100 SY 10-11 2792 SY 11-12 2660 SY 12-13 2559 SY 13-14 2354 SY 14-15 2677 Total Incidents
47 2010-2015 Incidents by High School Chart 33: Incidents by School PATRICK HENRY 1800 1600 1400 1200 Incidents 1000 800 600 400 200 0 SY 10-11 1433 SY 11-12 1630 SY 12-13 1176 SY 13-14 1413 SY 14-15ffenders 1528 PATRICK HENRY Incidents WILLIAM FLEMING 1600 1400 1200 1000 Incidents 800 600 400 200 0 SY 10-11 1359 SY 11-12 1030 SY 12-13 1383 SY 13-14 941 SY 14-15ffenders 1149 WILLIAM FLEMING Incidents
48 2014-2015 High School Data Snapshot Chart 34: Incident Summary Incident Incident Count Count 04_Off. Vs. Persons 6% % of Incidents by Category SSIR SSIR 02_Off. Vs Stu. 1% 01_Weapons 0% 03_Off. Vs. Staff 1% Weapons Off. Vs Stu. Off. Vs. Staff Off. Vs. Persons ATOD Prop. Off. Dis./Disrup. Tech. Off. Other Off. Total 14 37 05_ATOD 2% 06_Prop. Off. 1% 09_Other Off. 15% 08_Tech. Off. 5% 19 150 63 23 1844 131 396 2677 07_Dis./Disrup . Beh. 69%
49 2014-2015 Data Snapshot Chart 35: Offenders by School WILLIAM FLEMIING PATRICK HENRY 1400 1800 1600 1200 1400 1000 1200 800 Axis Title Axis Title 1000 800 600 600 400 400 200 200 0 0 Offenders Incidents Offenders Incidents PATRICK HENRY HIGH SCHOOL WILLIAM FLEMING HIGH SCHOOL 521 1528 427 1149
50 2014-2015 Data Snapshot Disciplinary Actions Chart 36: High School OSS and Police Referrals 3000 2500 2000 Axis Title 1500 1000 500 0 PATRICK HENRY HIGH SCHOOL 521 1528 443 150 WILLIAM FLEMING HIGH SCHOOL 427 1149 424 92 Total 948 2677 867 242 Offender Incident OSS Police