Science and Economics of Solid-State Lighting Technology
Explore the science, technology, and economic perspectives of solid-state lighting through research conducted at Sandia National Laboratories. This includes insights into artificial lighting, human productivity, and energy consumption, offering a comprehensive view of the impact and potential advancements in lighting technology.

Download Presentation

Please find below an Image/Link to download the presentation.
The content on the website is provided AS IS for your information and personal use only. It may not be sold, licensed, or shared on other websites without obtaining consent from the author. If you encounter any issues during the download, it is possible that the publisher has removed the file from their server.
You are allowed to download the files provided on this website for personal or commercial use, subject to the condition that they are used lawfully. All files are the property of their respective owners.
The content on the website is provided AS IS for your information and personal use only. It may not be sold, licensed, or shared on other websites without obtaining consent from the author.
E N D
Presentation Transcript
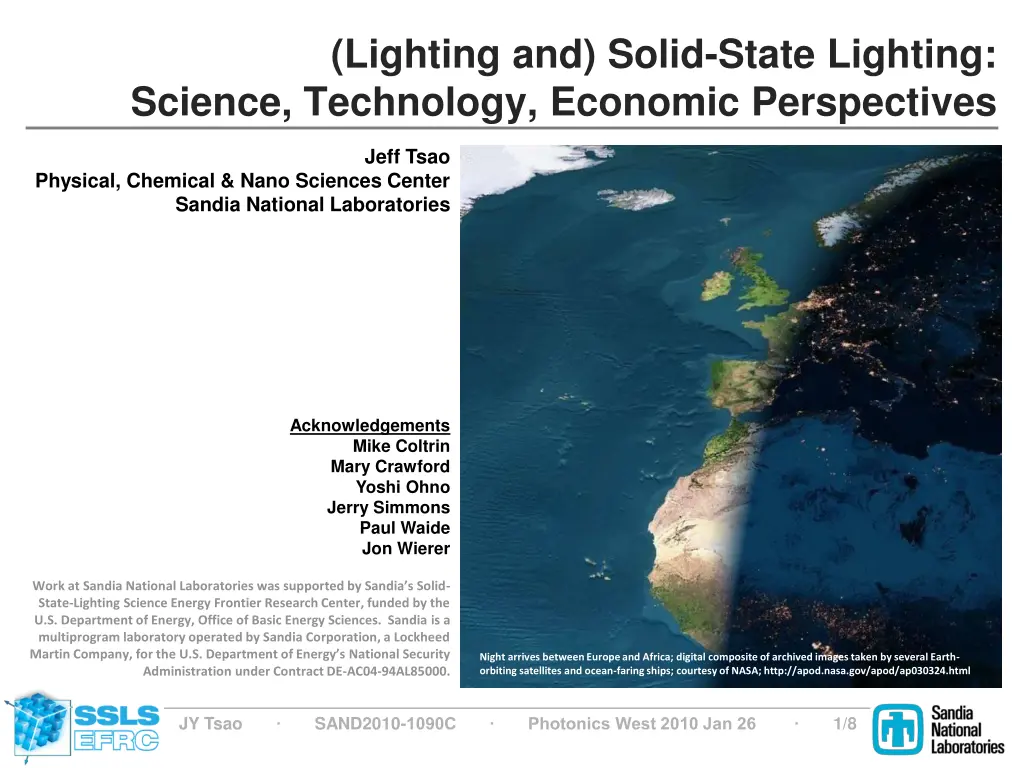
(Lighting and) Solid-State Lighting: Science, Technology, Economic Perspectives Jeff Tsao Physical, Chemical & Nano Sciences Center Sandia National Laboratories Acknowledgements Mike Coltrin Mary Crawford Yoshi Ohno Jerry Simmons Paul Waide Jon Wierer Work at Sandia National Laboratories was supported by Sandia s Solid- State-Lighting Science Energy Frontier Research Center, funded by the U.S. Department of Energy, Office of Basic Energy Sciences. Sandia is a multiprogram laboratory operated by Sandia Corporation, a Lockheed Martin Company, for the U.S. Department of Energy s National Security Administration under Contract DE-AC04-94AL85000. Earth at Night (courtesy of NASA) Night arrives between Europe and Africa; digital composite of archived images taken by several Earth- orbiting satellites and ocean-faring ships; courtesy of NASA; http://apod.nasa.gov/apod/ap030324.html JY Tsao SAND2010-1090C Photonics West 2010 Jan 26 1/8
Artificial Lighting and Human Productivity Efficiency Consumption 0.72% = US$440B / US$60T 6.5% = 1 TWc / 16 TWc CoL ($/Mlmh) CoE/ 105.4 101.5 1.E+04 104 1.E+03 103 CN 2005 CN 2005 CN 2006 CN 2006 JP+KR 2005 JP+KR 2005 per capita consumption of light 100% 100% AU+NZ 2005 AU+NZ 2005 Efficiency Efficiency WRLD WRLD- -GRID 2005 GRID 2005 OECD OECD- -EU 2005 EU 2005 SSL? phi (data) Mlmh/(per-yr) 1.E+02 102 Luminous efficacy Luminous efficacy US 2001 US 2001 FSU 2000 FSU 2000 US 2001 US 2001 JP+KR 2005 JP+KR 2005 UK 2000 UK 2000 CN 2006 CN 2006 WRLD WRLD- -DEV 2005 DEV 2005 OECD OECD- -EU 2005 EU 2005 101 FSU 2000 FSU 2000 10 103 3 1.E+01 CN 1993 CN 1993 UK 1950 UK 1950 HID Fluorescent Incandescent CN 2005 CN 2005 101 1.E+01 lm/We e) ) UK 2000 UK 2000 AU+NZ 2005 AU+NZ 2005 UK 1950 UK 1950 CN 1993 CN 1993 lm/We 10 104 4 [Mlmh/(per-yr)] ( (lm/W 1 1 UK 1900 UK 1900 102.8 WRLD WRLD- -UNDEV 1999 UNDEV 1999 UK 1900 UK 1900 1 1.E+00 Gas Kerosene 10-2 UK 1850 UK 1850 1.E-02 10 105 5 UK 1800 UK 1800 10 101 1 UK 1850 UK 1850 UK 1800 UK 1800 WRLD WRLD- -NONGRID NONGRID Candles 1.E-01 10-1 UK 1750 UK 1750 UK 1700 UK 1700 UK 1750 UK 1750 1999 1999 UK 1700 UK 1700 10 102 2 Tsao and Waide, The World s Appetite for Light: Empirical Data and Trends Spanning Three Centuries and Six Continents, to be submitted to LEUKOS 10-5 Tsao and Waide, The World s Appetite for Light: Empirical Data and Trends Spanning Three Centuries and Six Continents, to be submitted to LEUKOS 10-2 1.E-05 1.E-02 10-5 10-2 101 104 gdp/CoL [Mlmh/(per-yr)] 1 1 101 102 103 104 105 CoE CoE ($/ ($/MW 1.E-05 1.E-02 1.E+01 1.E+04 10 100 1000 MWe eh h) ) 10000 100000 CoE ($/MWeh) phi (PPP model) Mlmh/(per-yr) 0.0072 $/(per-yr) $/Mlmh JY Tsao SAND2010-1090C Photonics West 2010 Jan 26 2/8
Luminous Efficacy Characteristics of 100%-Efficient Lighting 800 800 Human Eye Response 600 (lm/W) 400 400 (lm/W) 100 nm 200 0 0 100 100 700 CCT = 3,800K R9 = Ra/4 400 500 600 Color Rendering Index Color Rendering Index Wavelength (nm) 90 90 90 90 CRI 85 614 nm 459 nm 535 nm 573 nm CRI 80 80 80 80 400 lm/W 70 70 70 70 (Ra) (Ra) 60 1.5 60 60 60 300 300 350 400 450 350 400 450 0.37 400 500 600 700 Luminous Efficacy (lm/W) 0.23 0.24 Relative Power lm/ W Relative 1.0 1.0 Wavelength (nm) Power 0.18 0.5 0.5 All linewidths 1-nm FWHM 0 0.8 0.0 Reflectances 0.8 400 500 600 700 Relative Reflectance 200 nm Samples 1-8 8 7 6 Wavelength (nm) 0.6 1 5 Munsell 8 4 Relative 0.4 3 7 0.4 J.M. Phillips, et al, Challenges to Ultra-Efficient SSL , Laser & Photonics Reviews (2007). Calculations based on white LED simulator 5-3 (Y. Ohno, NIST). 2 0.2 0 0.0 400 400 500 600 700 Wavelength (nm) 500 600 700 Wavelength (nm) JY Tsao SAND2010-1090C Photonics West 2010 Jan 26 3/8
Efficiencies of Actual Lighting Technologies 600 600 Human eye Human eye response (photopic) response 400 400 (lm/W) 200 200 0 0 300 400 500 600 700 800 900 1000 All spectra normalized to 1W wallplug power Spectral Power Distribution 100%-Efficient SSL CCT 3,800K 400 lm/W 0.1 21%-Efficient Fluorescent CCT 3,500K 85 lm/W Courtesy of Lauren Rohwer 0.01 (W/nm) 3.5%-Efficient Incandescent CCT 3,000K 14 lm/W 0.001 14%-Efficient 58 lm/W SSL Commercial Late-2009 Warm-White CCT 3,100K Driven at 0.7A 0.0001 1E-05 300 400 500 600 Wavelength (nm) 700 800 900 1000 JY Tsao SAND2010-1090C Photonics West 2010 Jan 26 4/8
Anatomy of State-of-Art Commercial SSL http://bobbymercerbooks.com = 14% = 58 lm/W CRI = 85 CCT = 3,100K Spectral 78% Phosphor/Package Internal quantum effic Stokes deficit Scattering/absorption 54% 90% 76% 80% Blue LED Joule IQE at low power Droop at high power Light extraction 33% 85% 70% 70% 80% 0.7A Thin-Film Flip Chip (TFFC) schematic courtesy of Jon Wierer 1 mm JY Tsao SAND2010-1090C Photonics West 2010 Jan 26 5/8
Technology Grand Challenges for Luminous Efficacy Eliminate blue LED droop Narrow-linewidth shallow-red color conversion Fill in the red-yellow- green gap 1 2 3 Target: 200 A/cm2 0.3 IQE0.2 456 535 573 614 0.1 456 614 600 Luminous Efficacy 0 1 400 Auger- like k (ns-1) 0.1 Human eye response Spontaneous Emission 200 (lm/W) Schockley-Read-Hall 0.01 0 0.001 State-of-art LED 400 500 600 700 0.1 1.0 10 100 1,000 10,000 J (A/cm2) distribution (W/nm) 6.E-04 Spectral power 1W LEDs 350 mA Bn 4.E-04 = IQE INJ + + 2 A Bn Cn 2.E-04 0.E+00 Shockley-Read-Hall Spontaneous Emission 400 500 600 700 Courtesy of M. Krames, Philips-Lumileds Wavelength (nm) Auger-like Rate constants for 510nm LED, after UT Schwarz, Emission of biased green quantum wells in time and wavelength domain, SPIE Proc 7216, 7216U-1 (2009). JY Tsao SAND2010-1090C Photonics West 2010 Jan 26 6/8
What about Cost of Light? CoLcap is already ~CoLope/6, so is the key 2012 may be the beginning of the transition 100.00 100 100 2004.8 CoL = CoLcap + CoLope ($/Mlmh) 2011.8 2011.8 2008.3 2005.8 SSL CoLcap = $Win/[ ] ($/Mlmh) Cost of Light ($/Mlmh) 10 2007.2 Incandescent 10 10.00 0.35A 1:6 Ratio 0.7A 2008.5 Incandescent Fluorescent 2009.7 1.5A 1 HID Fluorescent HID 1.00 1 B LED 0.1 Phosphors Adapted from Navigant, U.S. Lighting Market Characterization, U.S. DOE (2002); RGB Adapted from JY Tsao, ME Coltrin, MH Crawford, JA Simmons, SSL: An Integrated Human Factors, Technology and Economic Perspective, Proc IEEE (to be published). and from JY Tsao, ME Coltrin, MH Crawford, JA Simmons, SSL: An Integrated Human Factors, Technology and Economic Perspective, Proc IEEE (to be published). Perfect SSL Perfect 0.1 0.01 0.10 2000 2005 2010 2015 2020 Year 0.01 0.1 1 10 100 CoLope = CoE/ ($/Mlmh) 2000 2005 2010 Year 2015 2020 JY Tsao SAND2010-1090C Photonics West 2010 Jan 26 7/8
Earth at Night (courtesy of NASA) JY Tsao SAND2010-1090C Photonics West 2010 Jan 26 8/8
 Solid-State Lighting:")


")


![Illuminating Tomorrow: The World of Photonics with [Company Name]](/thumb/255424/illuminating-tomorrow-the-world-of-photonics-with-company-name.jpg)