Selecting Data Analysis Techniques: Bivariate Methods Explained

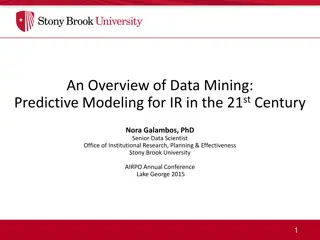
In this PowerPoint, the focus is on bivariate data analysis techniques, specifically linear regression. The presentation delves into the concept of linear models for two numerical variables and explores examples like predicting weights from heights and analyzing correlations between various factors. It also touches upon the importance of near-normal distributions in regression analysis and introduces multiple regression as an extension of linear models, discussing its application in predicting outcomes based on multiple predictors. Examples highlight the predictive power of variables like per capita income and inequality levels on different parameters.

Uploaded on Mar 09, 2025 | 0 Views
Download Presentation

Please find below an Image/Link to download the presentation.
The content on the website is provided AS IS for your information and personal use only. It may not be sold, licensed, or shared on other websites without obtaining consent from the author.If you encounter any issues during the download, it is possible that the publisher has removed the file from their server.
You are allowed to download the files provided on this website for personal or commercial use, subject to the condition that they are used lawfully. All files are the property of their respective owners.
The content on the website is provided AS IS for your information and personal use only. It may not be sold, licensed, or shared on other websites without obtaining consent from the author.
E N D
Presentation Transcript
Selecting Data Analysis Techniques R. Garner, DePaul University
In this PowerPoint. We will explain how the types of variables point to specific choices of data analysis techniques. Provide examples. Specify whether more than one choice is possible. Most of our coverage will be for bivariate techniques (a predictor and an outcome variable).
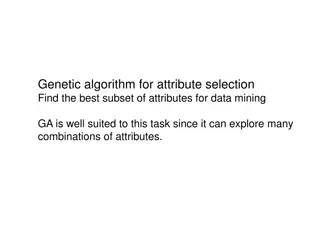
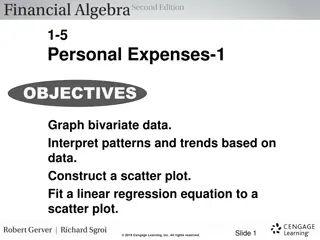
Linear regression/linear model This is a data analysis technique that is usually used for two variables, both of which are numerical. Usually the variables are continuous (we can subdivide the measurements indefinitely) or can be treated that way (e.g., measured in dollars). We will find the correlation coefficients, the coefficients for a linear equation, R-squared, and visualize the relationship as a scatterplot with a regression line.
Examples Can we use individuals heights to predict their weights? Is there a correlation between cities unemployment rates and their crime rates? Is there a correlation between cities income per capita and amount of green space per capita? Do countries with higher per capita incomes have lower infant mortality rates? Is there a relationship between a country s level of income inequality and the crime rate?
Near-normal variables? Numerical variables in a linear regression should be near normal have a distribution that is sort of normal. If they are positively skewed (and do not have 0 values), they can be log transformed an easy procedure in most software before the regression analysis. For example: per capita income, number of physicians per capita in countries.
Multiple regression Regression analysis (linear model) can be carried out with more than one predictor variable. The predictor variables can be binaries as well as continuous numerical variables. In a linear probability model, we have a binary outcome variable and multiple predictors. In a logistic regression (which is not linear), we have a binary outcome variable.
Examples of multiple regression questions Are per capita income and level of inequality predictors of nations infant mortality rates? Are the percentage of college graduates and median household income predictors of communities crime rates? Linear probability model or logistic regression, with a binary outcome: Can we predict recidivism (conviction of a crime within three years of release) from a combination of: the length of a prior prison term, characteristics of the individual, and the poverty rate of the community in which they live?
Compare Means procedures The overall logic is that we have a categoric predictor variable (could be a binary) and a numerical outcome variable (could be a binary). Do the groups or factors of the predictor variable have different means on the outcome variable? Do the groups or factors have different proportions for a binary outcome variable?
Examples Do men, women, and non-binary individuals have different means for their javelin throws? Are tall, short, or medium-height people different in the proportion that says Yes, I love watching basketball! Are pets owned by people in the city smaller on average than pets owned by people in the country? Do attorneys in corporate law have higher mean earnings than public defenders? Is religious affiliation (multiple categories for a nominal variable) a predictor of mean time spent on social media?
Two options If the predictor variable is a binary (TWO groups or factors) we can do t-test. An ANOVA is an option. If the predictor variable has more than two categories, we MUST do an ANOVA. Look at the examples on the previous slide: which ones have to be analyzed with an ANOVA? For which could we do a t-test?
Proportions too! Remember that the outcome variable in Compare Means procedure can be a proportion for a binary variable, as well as a mean for a regular numerical variable. For example, outcomes survival rates for different categories of passenger tickets on the Titanic; yes or no questions like basketball fandom; voting choice in a two-candidate election. Remember to code the binary outcome as 0 or 1.
Post-hoc result for ANOVA If the predictor variable has only two categories (always the case in a t-test), we do NOT need to further analyze a statistically significant result. But if the ANOVA has a multi-category predictor variable and a significant result, we have to do a post-hoc test to see which PAIRS of categories have significantly different means (or proportions) for the outcome variable. Bonferroni is recommended.
Two-way ANOVA In a Two-Way ANOVA, we can compare means (or proportions) of the outcome variable for TWO categorical/binary predictor variables. Example: We use TWO multi-category predictor variables (RELIGION and a three- category GENDER variable man, woman, and non-binary) to see if these variables predict differences in the outcome mean TIME ON SOCIAL MEDIA.
Cross-tabs/contingency tables Cross-tabs are mandatory if we have two multi-category variables (both the predictor and the outcome). They may be used if either or both of the two variables is/are binary. Do NOT even think of using cross-tabs if one or the other variable is numerical with a big range of values. You will get a MONSTER and completely unreadable table.
Examples Is an individual s RELIGION (multi-category nominal variable) related to POLITICAL VIEWS (defined as a five-category variable: left-wing, liberal, center, conservative, right-wing)? Is a person s regional LOCATION (northwest, southwest, northeast, southeast) related to a five-point Likert-type item about GUN SAFETY REGULATION?
Chi-square and Measures of Association Many researchers just look at the result for a chi-square test of significance; others also look at the measures of association consult text for which to use, noting whether your categorical variable is nominal or ordinal.
Layering third variable A contingency table can be elaborated with a layering variable, usually inserted into the rows. This third variable helps us to see if the initial bivariate ( 0-order ) relationship is spurious or intervening or whether an interaction effect is revealed. THAT S ALL, FOLKS! Beyond three variables, it is almost impossible to use a contingency table.
Final thoughts Notice how it is very difficult to go beyond two predictor variables with compare-means (two-way ANOVA) and contingency tables. That is one of the reasons why researchers like the linear models they make it possible (and easy to read) to include more than two predictor variables. On the other hand, t-tests are fine for the experimental-control group Randomized Controlled Trial set-up, so that is why folks in medical research are familiar with t-tests. T-tests are less commonly seen in social science research, which tends to use multivariate models.
Key Termstalk the talk to be included in the conversation! Bivariate, binary variable, predictor variable(s), outcome variables, multivariate, linear model (AKA linear regression), compare-means procedures, means and proportions, t-test, ANOVA, post-hoc tests, two-way ANOVA, cross- tabs/contingency table, multi-category nominal and ordinal variables. Regression output: correlation coefficient, scatter-plot, R-squared, regression coefficients.