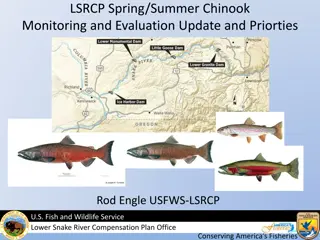
Selection Across Four Generations in Chinook Salmon Breeding Program
An evaluation of selection across four generations within a Chinook salmon supportive breeding program, exploring genetic divergence, identifying associated loci with phenotypic traits, and ongoing research. The study compares segregated vs. integrated wild populations, examines the impact of managed gene flow, and utilizes discriminant analysis of principal components. Effective number of breeders is assessed to understand divergence due to genetic drift. The experimental approach includes a detailed genetic map and discriminant analysis to gain insights into the breeding program's outcomes.

Download Presentation

Please find below an Image/Link to download the presentation.
The content on the website is provided AS IS for your information and personal use only. It may not be sold, licensed, or shared on other websites without obtaining consent from the author.If you encounter any issues during the download, it is possible that the publisher has removed the file from their server.
You are allowed to download the files provided on this website for personal or commercial use, subject to the condition that they are used lawfully. All files are the property of their respective owners.
The content on the website is provided AS IS for your information and personal use only. It may not be sold, licensed, or shared on other websites without obtaining consent from the author.
E N D
Presentation Transcript
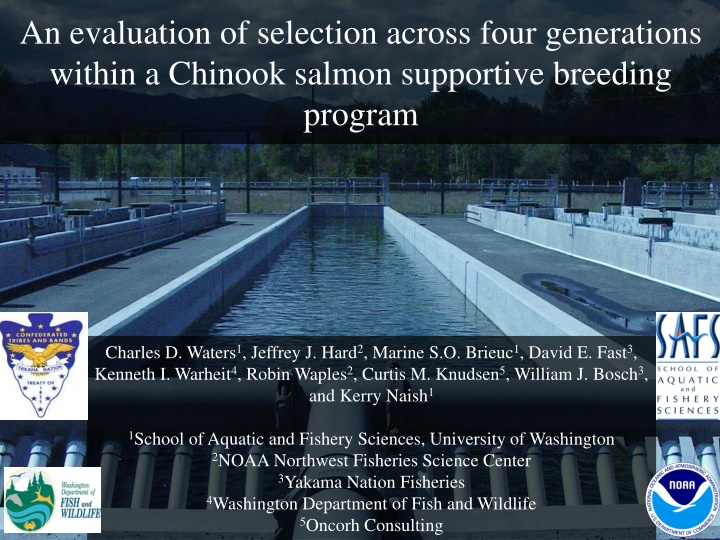
An evaluation of selection across four generations within a Chinook salmon supportive breeding program Charles D. Waters1, Jeffrey J. Hard2, Marine S.O. Brieuc1, David E. Fast3, Kenneth I. Warheit4, Robin Waples2, Curtis M. Knudsen5, William J. Bosch3, and Kerry Naish1 1School of Aquatic and Fishery Sciences, University of Washington 2NOAA Northwest Fisheries Science Center 3Yakama Nation Fisheries 4Washington Department of Fish and Wildlife 5Oncorh Consulting
Outline 1)Quick review of the study system 2)Updated results of genetic divergence with the 4th hatchery generation 3)Preliminary results for identifying loci that are associated with phenotypic traits of adult spawners 4)Ongoing research
Segregated vs. Integrated Wild Population Segregated Line Integrated Line Hatchery Fish 2nd Generation 2nd Generation Hatchery Fish 3rd Generation 3rd Generation Has managed gene flow reduced divergence from founder population?
1998 P1-wild founders Segregated Line Integrated Line 2002 2002 F1 adults-wild founders (no hatchery influence) F1 adults-1st gen hatchery 2006 2006 F2 adults-natural origin (possible hatchery influence) F2 adults-2nd gen hatchery 2010 2010 F3 adults-natural origin (possible hatchery influence) F3 adults-3rd gen hatchery 2014 2014 F4 adults-natural origin (possible hatchery influence) F4 adults-4th gen hatchery
Experimental Approach Chinook Map (Brieuc et al. 2014), 7146 markers Metacentric Acrocentric Joseph R. Tomelleri Number of loci = 8,872 RAD loci (4,178 are mapped)
Discriminant Analysis of Principal Components -4 -2 0 2 DF 1 (59.3 %) 4 6
Effective Number of Breeders Used to examine divergence due to genetic drift Genetic drift is the dominant evolutionary process in small populations (loss of genetic variation; inbreeding) Avg. # broodstock: INT=363; SEG=85 Estimated effective number of breeders using the linkage disequilibrium and temporal methods
Linkage Disequilibrium Temporal Nspawners 563 387 338 8044 98 3364 69 9267 72
1998 P1-wild founders Segregated Line Integrated Line 2002 2002 F1 adults-wild founders (no hatchery influence) F1 adults-1st gen hatchery 2006 2006 F2 adults-natural origin (possible hatchery influence) F2 adults-2nd gen hatchery 2010 2010 F3 adults-natural origin (possible hatchery influence) F3 adults-3rd gen hatchery 2014 2014 F4 adults-natural origin (possible hatchery influence) F4 adults-4th gen hatchery
Linkage Disequilibrium Temporal Nspawners 563 387 338 8044 98 3364 69 9267 72
Is Selection Acting on Fitness-Related Traits? Look for associations between genetic markers and traits of interest using GWAS and Random Forest analyses. Preliminary results for GWAS on 361 individuals at 3428 loci Return date to Roza Age at return Weights at Roza and CESRF Fork length at CESRF
Summary of Results - Segregated line is still slowly diverging over time - FST also increased in F4 INT generation - Genetic drift is driving divergence of SEG line (broodstock size) - Signatures of selection were identified using 3 methods with good agreement; more abundant and consistent in segregated line - Biological significance? No links to fitness-related traits in preliminary GWAS analyses
Ongoing Research 1) Finalize analyses to identify loci linked fitness related traits in adults, and determine if these traits are responding to hatchery selection 2) Identify genomic regions associated with hatch timing, early growth rate, and disease resistance
Acknowledgments UW MERlab: Dan Drinan, Miyako Kodama, Isadora Jimenez-Hidalgo, Katrina van Raay, Lorenz Hauser Charlie Strom and all CESRF staff Steve Schroder (ret.) and Todd Kassler WDFW Mike Ford, NOAA Daniel Goodman, MSU & Brian Riddell, PSF Funded by Federal Biop funds Hatchery reform and Hall Conservation Genetics Award at UW
Questions? cwaters8@uw.edu
Overlap across Tests for Adaptive Divergence in Segregated Line 1) FTEMP Simulates neutral genetic divergence in a single population over time Incorporates estimates of Nb, sample size, and # generations 2) Bayescan Identifies candidate loci under selection based on differences in allele frequencies between populations 3) Sliding Window Analysis Identifies regions of elevated divergence based on empirical genome-wide distribution of FST
Overlap across Tests for Adaptive Divergence in Segregated Line Chromosome Map Position (cM) # gens SW INT # gens SW SEG FTEMPINT FTEMPSEG Bayescan Ots04 37.52-43.15 2 2 2 Ots05 87.43-95.05 1 3 1 1 Ots06 94.64-100.65 1 1 1 1 Ots11 57.77-71.46 2 3 1 2 1 Ots12 26.14-35.29 1 2 2 2 Ots15 132.33-139.26 1 1 1 1 Ots20 93.65-99.49 1 2 2 1 Possibly the first signatures of domestication selection identified in Pacific salmon
INT: Return year 2001 2002 2003 2004 2005 2006 2007 2008 2009 2010 2011 2012 2013 2014 Initiation year 1997 1998 P1 1999 2000 F1 Wild F2 INT F3 INT F4 INT SEG: Return year 2001 2002 2003 2004 2005 2006 2007 2008 2009 2010 2011 2012 2013 2014 Initiation year 1997 1998 P1 1999 2000 F1 Hatchery F2 SEG F3 SEG F4 SEG


![[✔PDF✔⚡] ✔DOWNLOAD✔ Ancestral Knowledge Of Smoking Salmon: The Ultimate Gui](/thumb/68084/pdf-download-ancestral-knowledge-of-smoking-salmon-the-ultimate-gui.jpg)