Seneca County Health Status Assessment 2022 Report Insights
Explore key findings from the 2022 Seneca County Health Status Assessment Report, including insights on adult health care access, coverage, utilization, and disparities. Uncover details on uninsured rates, health coverage sources, and access challenges faced by residents. Gain valuable information to enhance community health initiatives.
Download Presentation

Please find below an Image/Link to download the presentation.
The content on the website is provided AS IS for your information and personal use only. It may not be sold, licensed, or shared on other websites without obtaining consent from the author. If you encounter any issues during the download, it is possible that the publisher has removed the file from their server.
You are allowed to download the files provided on this website for personal or commercial use, subject to the condition that they are used lawfully. All files are the property of their respective owners.
The content on the website is provided AS IS for your information and personal use only. It may not be sold, licensed, or shared on other websites without obtaining consent from the author.
E N D
Presentation Transcript
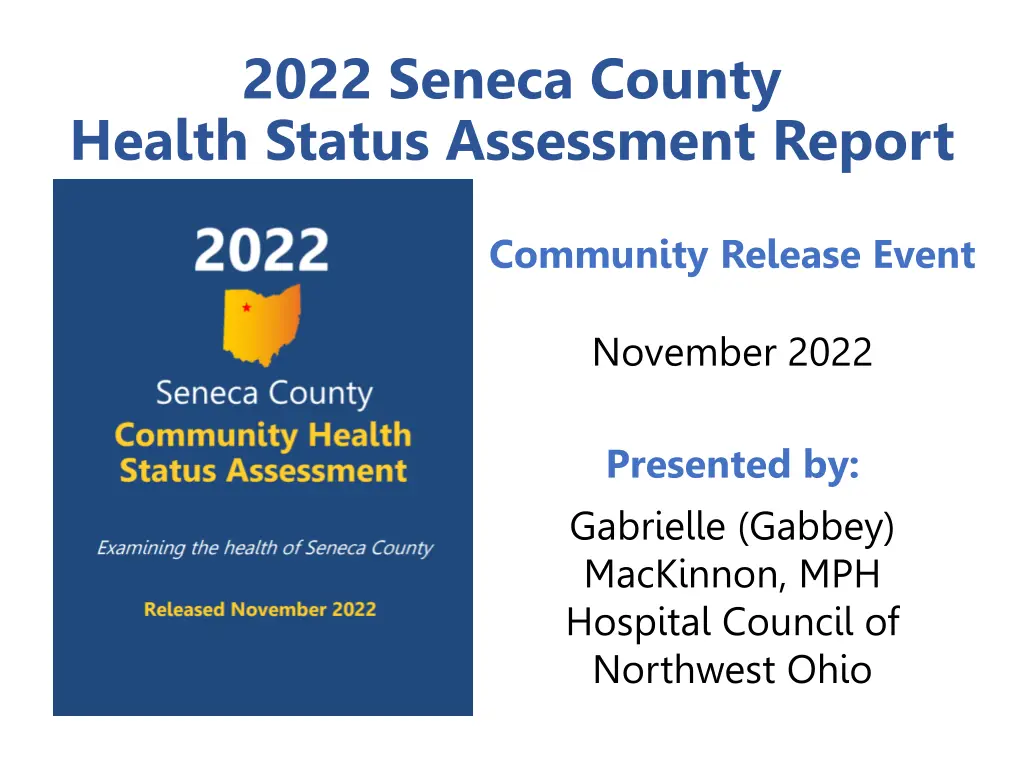
2022 Seneca County Health Status Assessment Report Community Release Event November 2022 Presented by: Gabrielle (Gabbey) MacKinnon, MPH Hospital Council of Northwest Ohio
Adult Health Care Access Health Care Coverage Health Care Access and Utilization Preventive Medicine Women s Health Men s Health Oral Health
Health Care Coverage 93% of adults had health care coverage 7% of adults were without coverage Seneca County adults had the following issues regarding health care coverage: Cost (37%) Opted out of certain coverage because they could not afford it (12%) Service not deemed medically necessary (9%) Could not understand their insurance plan (8%) Working with their insurance company (7%) Opted out of certain coverage because they did not need it (6%) Etc.
Health Care Coverage Source of Health Coverage for Seneca County Adults Medicaid or medical assistance 12% Medicare 20% Employer 46% Self-purchased 4% Someone else's employer 9% Military, CHAMPUS, TriCare, CHAMPVA, or the VA 3% Multiple-governmental sources 1% Health Insurance Marketplace 2% Multiple-private sources 3%
Health Care Coverage Uninsured Seneca County Adults 20% 15% 15% 11% 11% 10% 9% 8% 8% 7% 6% 4% 2% 0% Total Male Female 19-64 Years 65 & Over Income <$25K Income $25K Plus Seneca 2009 Seneca 2013 Seneca 2016 Seneca 2019 Note: Caution should be used when interpreting subgroup results as the margin of error for any subgroup is higher than that of the overall survey Seneca County 2009 Seneca County 2013 Seneca County 2016 Seneca County 2019 Seneca County 2022 Ohio 2020 U.S. 2020 Adult Comparisons Uninsured 11% 15% 8% 9% 7% 9% 11%
Health Care Access and Utilization 75% of Seneca County adults visited a doctor for a routine checkup in the past year Increasing to 88% of those over the age of 65 Adults did not get the following major or preventive care because of cost: Medication (11%) Doctor/health care provider (9%) Lab testing (6%) Mental health services (6%) Weight loss programs (6%) Surgery (5%) Etc.
Health Care Access and Utilization Adults usually visited the following places when they were sick or needed advice about their health: Doctor s office (47%) Multiple places, including doctor s office (7%) Family and friends (6%) Urgent care center (5%) Internet (4%) Hospital emergency room (3%) Etc.
Health Care Access and Utilization Seneca County Adults Who Had a Routine Checkup in the Past Year 100% 88% 79% 80% 76% 75% 74% 74% 72% 68% 68% 60% 57% 52% 40% 20% 0% Total Male Female 19-64 Years 65 & Over Income <$25K Income $25K Plus Seneca 2009 Seneca 2013 Seneca 2016 Seneca 2019 Note: Caution should be used when interpreting subgroup results as the margin of error for any subgroup is higher than that of the overall survey Seneca County 2009 Seneca County 2013 Seneca County 2016 Seneca County 2019 Seneca County 2022 Ohio 2020 U.S. 2020 Adult Comparisons Visited a doctor for a routine checkup (in the past 12 months) 52% 57% 68% 68% 75% 77% 76% Had at least one person they thought of as their personal doctor or health care provider 86% 88% 81% 90% 87% 79% 77%
Preventive Medicine 54% of adults had a flu vaccine in the past 12 months Increasing to 73% of adults ages 65 and over Seneca County adults had the following vaccines: MMR in their lifetime (81%) Tetanus booster (including Tdap) in the past 10 years (75%) COVID-19 in their lifetime (72%) Chicken pox in their lifetime (65%) Hepatitis B in their lifetime (43%) Hepatitis A in their lifetime (32%) HiB in their lifetime (30%) Zoster (shingles) vaccine in their lifetime (20%) Meningococcal in their lifetime (19%) Human papillomavirus (HPV) vaccine in their lifetime (13%)
Preventive Medicine Seneca County Adults Who Received a Flu Vaccine Within the Past Year 80% 73% 71% 60% 54% 54% 53% 53% 52% 50% 49% 44% 38% 40% 20% 0% Total Male Female 19-64 Years 65 & Over Income <$25K Income $25K Plus Seneca 2009 Seneca 2013 Seneca 2016 Seneca 2019 Note: Caution should be used when interpreting subgroup results as the margin of error for any subgroup is higher than that of the overall survey Seneca County 2009 Seneca County 2013 Seneca County 2016 Seneca County 2019 Seneca County 2022 Ohio 2020 U.S. 2020 Adult Comparisons N/A 46% 58% 80% 67% 72% 72% Had a pneumonia vaccination (age 65 and over) Had a flu shot within the past year (age 65 and older) Ever had a shingles or zoster vaccine N/A Not Available *2017 BRFSS Data 38% 44% 71% 72% 73% 65% 68% N/A 5% 13% 19% 20% 29%* 29%*
Womens Health 54% of women ages 40 and over had a mammogram in the past year 66% had one in the past two years 56% of women ages 40 and over had a clinical breast exam in the past two years 70% of women ages 21-65 years old had a Pap smear in the past three years
Womens Health Seneca County Women's Health Exams Within the Past Year 75% 66% 61% 58% 58% 54% 54% 50% 50% 50% 49% 50% 47% 44% 44% 43% 42% 39% 39% 39% 39% 35% 34% 34% 32% 30% 25% 25% 16% 0% 0% Total Under 40 40 & Older Income <$25K Income $25K Plus Seneca 2009 Seneca 2013 Seneca 2016 Seneca 2019 Mammogram Breast Exam Pap Smear Note: Caution should be used when interpreting subgroup results as the margin of error for any subgroup is higher than that of the overall survey Seneca County 2009 Seneca County 2013 Seneca County 2016 Seneca County 2019 Seneca County 2022 Ohio 2020 U.S. 2020 Adult Comparisons Had a clinical breast exam in the past two years (age 40 and over) Had a mammogram in the past two years (age 40 and over) N/A 65% 64% 60% 56% N/A N/A N/A 68% 69% 69% 66% 71% 72% Had a Pap smear in the past three years N/A 72% 67% 67%* 70%* 77% 78% N/A- Not Available *2020 Ohio and U.S. BRFSS reports women ages 21-65
Mens Health 43% of Seneca County males had a Prostate- Specific Antigen (PSA) test in their lifetime 29% had one in the past year 64% of Seneca County males aged 50 and over had a PSA test in their lifetime 47% had one in the past year 25% of males had done a self-testicular exam in the past year
Mens Health Seneca County Men Who Had a PSA Test Within the Past Year 60% 47% 40% 31% 30% 29% 27% 21% 18% 20% 9% 0% Total Under 50 50 & Older Income <$25K Income $25K Plus Seneca 2009 Seneca 2013 Seneca 2019 Note: Caution should be used when interpreting subgroup results as the margin of error for any subgroup is higher than that of the overall survey Seneca County 2009 Seneca County 2013 Seneca County 2016 Seneca County 2019 Seneca County 2022 Ohio 2020 U.S. 2020 Adult Comparisons Had a PSA test within the past two years (age 40 and over) N/A 52% N/A 53% 51% 32% 32% N/A- Not Available
Oral Health 63% of Seneca County adults had visited a dentist or dental clinic in the past year Decreasing to 44% with incomes less than $25,000 70% of adults with dental insurance had been to the dentist in the past year When asked the main reason for not visiting a dentist in the last year, Seneca County adults gave the following responses: Cost (20%) No reason to go/had not thought of it (19%) Had dentures (11%) Did not have/know a dentist (7%) Etc.
Oral Health Seneca County Adults Who Visited a Dentist or Dental Clinic in the Past Year 80% 69% 69% 67% 66% 65% 63% 62% 60% 59% 60% 55% 44% 40% 20% 0% Total Male Female 19-64 Years 65 & Over Income <$25K Income $25K Plus Seneca 2009 Seneca 2013 Seneca 2016 Seneca 2019 Note: Caution should be used when interpreting subgroup results as the margin of error for any subgroup is higher than that of the overall survey Seneca County 2009 Seneca County 2013 Seneca County 2016 Seneca County 2019 Seneca County 2022 Ohio 2020 U.S. 2020 Adult Comparisons Visited a dentist or dental clinic (within the past year) 62% 59% 67% 60% 63% 65% 67% Visited a dentist or dental clinic (5 or more years ago) 11% 13% 10% 9% 14% N/A N/A N/A Not Available
Adult Health Behaviors Health Status Perceptions Weight Status Tobacco Use Alcohol Consumption Drug Use Sexual Behavior Mental Health
Health Status Perceptions Seneca County Adult Health Perceptions* 100% 9% 9% 12% 13% 13% 14% 14% 15% 15% 24% 27% 80% 33% 44% 34% 37% 46% 41% 38% 42% 44% 60% 37% 46% 40% 55% 52% 50% 47% 47% 46% 45% 44% 41% 20% 36% 30% 0% Total Males Females 19-64 years 65 & Over Income <$25K Income $25K Plus Seneca 2009 Seneca 2013 Seneca 2016 Seneca 2019 Excellent/Very Good Good Fair/Poor *Respondents were asked: Would you say that in general your health is excellent, very good, good, fair or poor? Note: Caution should be used when interpreting subgroup results as the margin of error for any subgroup is higher than that of the overall survey
Health Status Perceptions Physical Health 18% of Seneca County adults rated their physical health as not good on four or more days in the previous month Adults reported their physical health as not good on an average on 3.7 days in the previous month Mental Health 35% of Seneca County adults rated their mental health as not good on four or more days in the previous month Adults reported their mental health as not good on an average on 4.9 days in the previous month
Health Status Perceptions Seneca County 2009 Seneca County 2013 Seneca County 2016 Seneca County 2019 Seneca County 2022 Ohio 2020 U.S. 2020 Adult Comparisons Rated general health as good, very good, or excellent 88% 87% 85% 87% 86% 85% 86% Rated general health as excellent or very good 55% 50% 47% 52% 44% 55% 57% Rated general health as fair or poor 12% 13% 15% 14% 14% 16% 13% Rated physical health as not good on four or more days (in the past 30 days) 21% 20% 22% 23% 18% 24%* 23%* Average number of days that physical health not good (in the past 30 days) (County Health Rankings) N/A 3.7 3.8 3.1 3.7 4.1** 4.7** Rated mental health as not good on four or more days (in the past 30 days) 16% 23% 27% 25% 35% 29%* 26%* Average number of days that mental health not good (in the past 30 days) (County Health Rankings) N/A 4.6 3.8 3.3 4.9 4.8** 4.1** Poor physical or mental health kept them from doing usual activities, such as self-care, work, or recreation (on at least one day during the past 30 days) 12% 23% 26% 24% 30% N/A N/A N/A Not Available *2019 BRFSS **2018 BRFSS as compiled by 2021 County Health Rankings
Weight Status 77% of all Seneca County adults were either overweight (38%), obese (39%) (includes severely and morbidly obese) by body mass index (BMI) 50% of adults were trying to lose weight 29% were trying to maintain their current weight or keep from gaining weight 1% were trying to gain weight Seneca County 2009 Seneca County 2013 Seneca County 2016 Seneca County 2019 Seneca County 2022 Ohio 2020 U.S. 2020 Adult Comparisons Obese (includes severely and morbidly obese, BMI of 30.0 and above) 27% 36% 39% 39% 39% 36% 32% Overweight (BMI of 25.0 29.9) 41% 35% 35% 39% 38% 34% 35% Normal weight (BMI of 18.5 24.9) 31% 28% 25% 20% 23% 29% 31%
Weight Status Seneca County Adult BMI Classifications* 100% 27% 30% 32% 36% 36% 39% 80% 40% 41% 39% 39% 47% 60% 41% 35% 50% 38% 47% 35% 38% 38% 37% 40% 39% 28% 20% 31% 28% 26% 25% 25% 23% 22% 22% 20% 20% 20% 0% Total Male Female 19-64 Years 65 & Over Income < $25K Income $25K Plus Seneca 2009 Seneca 2013 Seneca 2016 Seneca 2019 Normal Overweight Obese (includes severely and morbidly obese) *Percentages may not equal 100% due to the exclusion of data for those who were classified as underweight Note: Caution should be used when interpreting subgroup results as the margin of error for any subgroup is higher than that of the overall survey
Weight Status Seneca County adults reported the following reasons they chose the types of food they ate: Taste/enjoyment (60%) Cost (53%) Healthiness of food (44%) Ease of preparation/time (40%) Food they were used to (39%) What their family prefers (35%) Availability (28%) Etc. 5 or more servings 3-4 1-2 0 servings servings servings Fruit 4% 11% 74% 11% Vegetables 6% 14% 74% 6% Sugar-sweetened beverages 4% 10% 37% 49% Caffeinated beverages 8% 20% 55% 17%
Tobacco Use 15% of all Seneca County adults were current smokers 21% of adults were former smokers Seneca County adults used the following tobacco products in the past year: E-cigarettes or other electronic vapor products (19%) Cigarettes (9%) Chewing tobacco, snuff dip, Betel quid (3%) Little cigars (2%) Cigarillos (2%)
Tobacco Use Seneca County Adult Smoking Behaviors* 100% 80% 52% 55% 56% 59% 58% 61% 62% 64% 64% 71% 71% 60% 40% 20% 26% 29% 37% 25% 29% 22% 21% 22% 9% 13% 20% 20% 19% 19% 17% 16% 16% 15% 15% 14% 13% 11% 0% Total Male Female 19-64 Years 65 & Over Income <$25K Income $25K Plus Seneca 2009Seneca 2013Seneca 2016Seneca 2019 Current smoker Former smoker Never smoked *Respondents were asked: Have you smoked at least 100 cigarettes in your entire life? If yes, do you now smoke cigarettes every day, some days or not at all? Note: Caution should be used when interpreting subgroup results as the margin of error for any subgroup is higher than that of the overall survey
Tobacco Use Seneca County 2009 Seneca County 2013 Seneca County 2016 Seneca County 2019 Seneca County 2022 Ohio 2020 U.S. 2020 Adult Comparisons Current smoker (currently smoke some or all days) 19% 17% 13% 14% 15% 19% 16% Former smoker (smoked 100 cigarettes in lifetime & now do not smoke) 26% 25% 29% 22% 21% 24% 25%
Alcohol Consumption 58% of Seneca County adults had at least one alcoholic drink in the past month 25% of all adults were binge drinkers Seneca County adult drinkers consumed 3.3 drinks on average per drinking occasion Seneca County 2009 Seneca County 2013 Seneca County 2016 Seneca County 2019 Seneca County 2022 Ohio 2020 U.S. 2020 Adult Comparisons Current drinker (drank alcohol at least once in the past month) 56% 47% 56% 58% 58% 51% 53% Binge drinker (defined as consuming more than four [women] or five [men] alcoholic beverages on a single occasion in the past 30 days) 21% 19% 19% 26% 25% 16% 16% Drove after having perhaps too much alcohol to drink N/A N/A 7% 4% 6% 3% 2%
Alcohol Consumption Seneca County Average Number of Days Drinking Alcohol in the Past Month* 100% 90% 25% 31% 80% 30% 40% 42% 39% 44% 34% 39% 44% 51% 70% 17% 60% 11% 21% 13% 50% 18% 18% 19% 17% 18% 14% 40% 12% 30% 58% 54% 47% 47% 41% 20% 40% 40% 39% 39% 37% 34% 10% 0% Total Male Female 19-64 Years 65 & Over Income <$25K Income $25K Plus Seneca 2009 Seneca 2013 Seneca 2016 Seneca 2019 Did not drink any 1-2 days 3 or more days *Percentages may not equal 100% as some respondents answered don t know Note: Caution should be used when interpreting subgroup results as the margin of error for any subgroup is higher than that of the overall survey
Drug Use 7% of adults had used medication not prescribed for them or took more than prescribed to feel good or high and/or more active or alert during the past 6 months 15% of adults who misused prescription medication did so to alleviate physical or psychological pain Increasing to 24% of those ages 65 and older Adults who misused prescription medication obtained their medication from the following: Primary care physician (70%) From multiple doctors/health care providers (26%) Free from friend or family members (9%) Bought from a drug dealer (4%)
Drug Use Seneca County Adult Prescription Medication Misuse in Past 6 Months 15% 11% 10% 9% 8% 8% 7% 5% 5% 5% 5% 5% 4% 2% 0% Total Male Female 19-64 Years 65 & Over Income <$25K Income $25K Plus Seneca 2009 Seneca 2013 Seneca 2016 Seneca 2019 Note: Caution should be used when interpreting subgroup results as the margin of error for any subgroup is higher than that of the overall survey.
Drug Use 6% of adults had used recreational marijuana or hashish in the past 6 months Adults reported using the following recreational drugs in the past 6 months: Wax, oil, with CBD, or THC edibles (15%) Marijuana recommended by a physician (4%) Heroin/Fentanyl (2%) Methamphetamines (1%) Bath salts (1%) Cocaine (1%) Ecstasy/E/GHB (1%) Over-the-counter-medication (1%) Inhalants (1%) LSD (1%) Synthetic marijuana/K2 (1%)
Drug Use Seneca County Adult Marijuana Use in Past 6 Months 15% 10% 10% 9% 8% 7% 6% 5% 5% 5% 5% 5% 4% 3% 0% Total Male Female 19-64 Years 65 & Over Income <$25K Income $25K Seneca 2009 Seneca 2013 Seneca 2016 Seneca 2019 Plus Note: Caution should be used when interpreting subgroup results as the margin of error for any subgroup is higher than that of the overall survey.
Sexual Behavior 65% of adults had sexual intercourse in the past year 3% of adults reported they had intercourse with more than one partner in the past year Seneca County adults used the following methods of birth control: No partner/not sexually active (26%) They/their partner were too old (16%) Vasectomy (13%) Hysterectomy (9%) Condoms (9%) Tubes tied (8%) Birth control pill (5%) Withdrawal (5%) Infertility (4%) Ovaries or testicles removed (3%) Rhythm method (2%) Gay or lesbian (2%) Emergency contraception (2%) Contraceptive implants (2%) IUD (1%)
Sexual Behavior Seneca County Number of Sexual Partners in the Past Year* 100% 28% 27% 26% 28% 34% 80% 35% 40% 31% 32% 2% 4% 5% 5% 57% 6% 6% 68% 3% 6% 60% 2% 40% 0% 71% 69% 67% 67% 63% 62% 0% 62% 60% 58% 20% 39% 31% 0% Total Male Female 19-64 Years 65 & Over Income <$25K Income $25K Plus Seneca 2009 Seneca 2013 Seneca 2016 Seneca 2019 One More than one None Respondents were asked: During the past year, with how many different people have you had sexual intercourse? Note: Caution should be used when interpreting subgroup results as the margin of error for any subgroup is higher than that of the overall survey
Mental Health 13% of Seneca County adults felt so sad or hopeless almost every day for two weeks or more in a row that they stopped doing usual activities 3% of adults seriously considered attempting suicide in the past year <1% of adults reported attempting suicide in the past year Seneca County 2009 Seneca County 2013 Seneca County 2016 Seneca County 2019 Seneca County 2022 Ohio U.S. Adult Comparisons 2020 2020 Considered attempting suicide in the past year Attempted suicide in the past year Felt so sad or hopeless almost every day for two weeks or more in a row 4% 4% 6% 3% 3% N/A N/A <1% <1% <1% <1% 3% N/A N/A 13% 13% 16% 11% 13% N/A N/A N/A Not available
Mental Health Seneca County adults indicated the following caused them anxiety, stress, or depression: Job stress (37%) Financial stress (33%) Current news/world events/political environment (31%) Death of close family member or friend (21%) Raising/caring for children (21%) Sick family member (17%) COVID-19 (16%) Fighting in the home (15%) Marital/dating relationship (14%) Poverty/no money (13%) Etc.
Adult Chronic Disease Cardiovascular Health Cancer Arthritis Asthma Diabetes Quality of Life
Cardiovascular Health 6% of Seneca County adults reported they had survived a heart attack or myocardial infarction Increasing to 16% of those ages 65 and older 4% of adults reported they had survived a stroke Increasing to 9% of those ages 65 and older 6% of adults reported they had angina or coronary heart disease Increasing to 15% of those ages 65 and older 4% of adults reported they had congestive heart failure Increasing to 9% of those with incomes less than $25,000
Cardiovascular Health Seneca County Adults Diagnosed with High Blood Pressure* 80% 60% 60% 48% 39% 37% 38% 40% 37% 36% 35% 33% 30% 28% 20% 0% Total Male Female 19-64 Years 65 & Over Income <$25K Income $25K Seneca 2009 Seneca 2013 Seneca 2016 Seneca 2019 Plus *Does not include respondents who indicated high blood pressure during pregnancy only. Note: Caution should be used when interpreting subgroup results as the margin of error for any subgroup is higher than that of the overall survey.
Cardiovascular Health Seneca County Adults Diagnosed with High Blood Cholesterol 60% 53% 44% 40% 40% 37% 37% 36% 36% 36% 35% 31% 28% 20% 0% Total Male Female 19-64 Years 65 & Over Income <$25K Income $25K Seneca 2009 Seneca 2013 Seneca 2016 Seneca 2019 Plus Note: Caution should be used when interpreting subgroup results as the margin of error for any subgroup is higher than that of the overall survey.
Cardiovascular Health Seneca County 2009 Seneca County 2013 Seneca County 2016 Seneca County 2019 Seneca County 2022 Ohio 2020 U.S. 2020 Adult Comparisons Had angina or coronary heart disease N/A 6% 5% 8% 6% 5% 4% Had a heart attack 5% 7% 6% 3% 6% 5% 4% Had a stroke 3% 2% 2% 3% 4% 4% 3% Had high blood pressure 33% 30% 28% 37% 38% 35%* 33%* Had high blood cholesterol 31% 36% 37% 37% 36% 33%* 33%* Had blood cholesterol checked within past 5 years N/A 79% 79% 83% 78% 85%* 87%* N/A Not Available *2019 BRFSS Data
Cancer 15% of Seneca County adults were diagnosed with cancer at some point in their lives Increasing to 23% of those ages 65 and older Of those diagnosed with cancer, they reported the following types: Breast (35%) Melanoma (16%) Cervical (15%) Other skin cancer (14%) Prostate (10%) Endometrial (10%) Non-Hodgkin s Lymphoma (8%) Testicular (7%) Hodgkin s Lymphoma (4%) Oral (4%) Rectal (4%) Leukemia (2%) Thyroid (2%) Colon (2%) Other types of cancer (8%)
Arthritis 31% of Seneca County adults had been diagnosed with arthritis Increasing to 62% of those ages 65 and older 80% Seneca County Adults Diagnosed with Some Form of Arthritis 62% 60% 38% 38% 40% 34% 31% 31% 31% 29% 30% 29% 27% 20% 0% Total Male Female 19-64 Years 65 & Over Income <$25K Income $25K Seneca 2009 Seneca 2013 Seneca 2016 Seneca 2019 Plus Note: Caution should be used when interpreting subgroup results as the margin of error for any subgroup is higher than that of the overall survey
Asthma 14% of Seneca County adults had been diagnosed with asthma Seneca County Adults Diagnosed with Asthma 25% 20% 17% 16% 15% 15% 15% 14% 14% 13% 13% 13% 12% 11% 10% 5% 0% Total Male Female 19-64 Years 65 & Over Income <$25K Income $25K Plus Seneca 2009 Seneca 2013 Seneca 2016 Seneca 2019 Note: Caution should be used when interpreting subgroup results as the margin of error for any subgroup is higher than that of the overall survey
Diabetes 11% of Seneca County adults were diagnosed with diabetes Increasing to 26% of those ages 65 and older Seneca County adults diagnosed with diabetes also had one or more of the following characteristics or conditions: 88% were obese or overweight 70% had been diagnosed with high blood cholesterol 69% had been diagnosed with high blood pressure
Diabetes Seneca County Adults Diagnosed with Diabetes 30% 26% 25% 20% 15% 15% 11% 11% 11% 11% 10% 10% 10% 10% 9% 10% 5% 0% Total Male Female 19-64 Years 65 & Over Income <$25K Income $25K Plus Seneca 2009 Seneca 2013 Seneca 2016 Seneca 2019 Note: Caution should be used when interpreting subgroup results as the margin of error for any subgroup is higher than that of the overall survey
Quality of Life 50% Seneca County Adult's Most Limiting Health Problems 40% 38% 40% 30% 26% 24% 24% 20% 10% 0% Back/Neck Problems Arthritis/Rheumatism Weight Walking problems Stress, Depression, Anxiety, or Emotional Problems
Adult Social Conditions Social Determinants of Health Environmental Conditions COVID-19 Parenting
Social Determinants of Health 9% of Seneca County adults needed help meeting their general daily needs such as food, clothing, shelter or paying utility in the past month Increasing to 24% of those with incomes less than $25,000 Seneca County adults experienced the following food security issues during the past year: Had to choose between paying bills and buying food (5%) Worried food might run out (5%) Loss of income led to food insecurity issues (4%) Food assistance was cut (4%) Went hungry/ate less to provide more food for their family (3%) Were hungry but did not eat because they did not have money for food (1%)
Social Determinants of Health Seneca County adults experienced the following adverse childhood experiences (ACEs): Lived with someone who was a problem drinker or alcoholic (21%) Their parents became separated or were divorced (19%) A parent or adult in their home swore at, insulted, or put them down (15%) Lived with someone who was depressed, mentally ill, or suicidal (14%) Someone at least 5 years older than them or an adult touched them sexually (10%) Their parent passed away (9%) Their family did not look out for each other, feel close to each other, or support each other (9%) Their parents or adults in their home slapped, hit, kicked, punched, or beat each other up (9%) Someone at least 5 years older than them or an adult tried to make them touch them sexually (7%) Their parents were not married (6%) A parent or adult in their home hit, beat, kicked, or physically hurt them (6%) Lived with someone who used illegal street drugs, or who abused prescription medications (6%) Lived with someone who served time or was sentenced to serve time in prison, jail or correctional facility (6%) Someone at least 5 years older than them or an adult forced them to have sex (4%) They didn t have enough to eat, had to wear dirty clothing, and had no one to protect them (4%) 13% of adults experienced 4 or more ACEs in their lifetime Increasing to 23% of those with incomes less than $25,000


