SGLT2 Inhibitors in Reduced Renal Function: Cross-Class Comparison
This study compares the impact of sodium-glucose-link transporter-2 inhibitors on renal function across various classes, shedding light on glucose outcomes and eGFR levels. The findings from the Association of British Clinical Diabetologists audits reveal insights into Empagliflozin, Canagliflozin, and Dapagliflozin. The analysis includes baseline characteristics, eGFR levels, HbA1c changes, and significant results.
Download Presentation

Please find below an Image/Link to download the presentation.
The content on the website is provided AS IS for your information and personal use only. It may not be sold, licensed, or shared on other websites without obtaining consent from the author.If you encounter any issues during the download, it is possible that the publisher has removed the file from their server.
You are allowed to download the files provided on this website for personal or commercial use, subject to the condition that they are used lawfully. All files are the property of their respective owners.
The content on the website is provided AS IS for your information and personal use only. It may not be sold, licensed, or shared on other websites without obtaining consent from the author.
E N D
Presentation Transcript
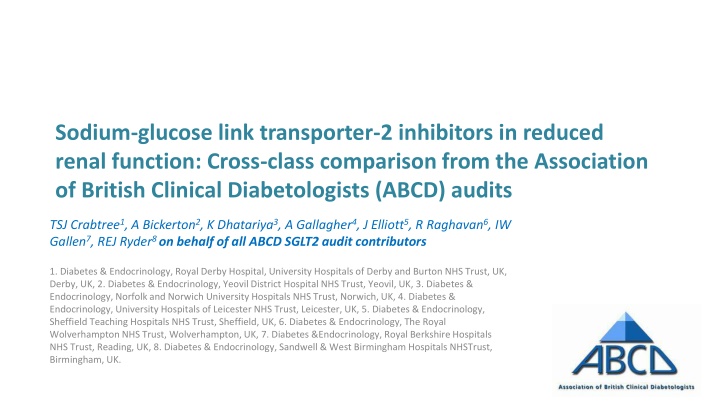
Sodium-glucose link transporter-2 inhibitors in reduced renal function: Cross-class comparison from the Association of British Clinical Diabetologists (ABCD) audits TSJ Crabtree1, A Bickerton2, K Dhatariya3, A Gallagher4, J Elliott5, R Raghavan6, IW Gallen7, REJ Ryder8 on behalf of all ABCD SGLT2 audit contributors 1. Diabetes & Endocrinology, Royal Derby Hospital, University Hospitals of Derby and Burton NHS Trust, UK, Derby, UK, 2. Diabetes & Endocrinology, Yeovil District Hospital NHS Trust, Yeovil, UK, 3. Diabetes & Endocrinology, Norfolk and Norwich University Hospitals NHS Trust, Norwich, UK, 4. Diabetes & Endocrinology, University Hospitals of Leicester NHS Trust, Leicester, UK, 5. Diabetes & Endocrinology, Sheffield Teaching Hospitals NHS Trust, Sheffield, UK, 6. Diabetes & Endocrinology, The Royal Wolverhampton NHS Trust, Wolverhampton, UK, 7. Diabetes &Endocrinology, Royal Berkshire Hospitals NHS Trust, Reading, UK, 8. Diabetes & Endocrinology, Sandwell & West Birmingham Hospitals NHSTrust, Birmingham, UK.
Disclosures TSJC has received speaker fees and support to attend conferences from Abbott Diabetes Care, Sanofi, NovoNordisk and Lilly
The ABCD audit programmes First audit launuched in 2014 (Dapagliflozin) Subsequent Canagliflozin (2016) and Empagliflozin (2017) audits Aims: Association between eGFR and glucose outcomes Previous work has demonstrated attenuated results and lower eGFR levels
Methods Data were extracted from the ABCD audit tool Those with baseline data and relevant follow-up data were included Multiple imputation of missing data and multiple linear regression modelling Total of 21,338 patients included Empagliflozin 11,234 Dapagliflozin 7,841 Canagliflozin 2,263
Baseline characteristics Empagliflozin 11,234 60.0 10.4 61.5% 96.6 22.0 33.7 7.0 8.2 (4.3-12.5) 82.0 11.7 9.1 1.6 75.8 17.1 Canagliflozin 2,263 60.1 10.6 61.9% 97.9 22.0 34.0 7.6 8.2 (4.0-12.5) 79.3 13.5 9.1 1.6 76.0 17.6 Dapagliflozin 7,841 59.9 10.3 60.6% 98.7 22.2 34.2 7.0 7.9 (4.2-11.9) 81.7 12.8 8.9 1.6 74.6 17.1 Total 27,508 60.80 10.4 61.2% 97.5 22.1 33.9 7.1 8.1 (4.2-12.3) 81.6 12.3 9.0 1.6 75.4 17.2 n= Age, mean SD Gender, % male Weight (kg), mean SD BMI (kg/m2), mean SD Diabetes duration (years), median (IQR) eGFR (mL/min/1.73m2), mean SD HbA1c (%), mean SD HbA1c (mmol/mol), mean SD eGFR % 90mL/min/1.73m2 60, <90mL/min/1.73m2 <60mL/min/1.73m2 49.6 47.7 2.8
eGFR>90 eGFR<90, >60 eGFR<60 All eGFR 0 -2 Change in HbA1c,mmol/mol -4 All -6 Empagliflozin Canagliflozin -8 Dapagliflozin -10 -12 -14 All results in figures significant to P<0.05. Error bars showing 95% CI
eGFR>90 eGFR<90, >60 eGFR<60 All eGFR 0 -2 Change in HbA1c,mmol/mol -4 All -6 Empagliflozin Canagliflozin -8 Dapagliflozin -10 -12 P=0.01 eGFR>90 vs <60 -14 All results in figures significant to P<0.05. Error bars showing 95% CI
eGFR>90 eGFR<90, >60 eGFR<60 All eGFR 0 -2 Change in HbA1c,mmol/mol -4 All -6 Empagliflozin Canagliflozin -8 Dapagliflozin -10 -12 P=0.046 Empa vs Dapa P=0.01 eGFR>90 vs <60 -14 All results in figures significant to P<0.05. Error bars showing 95% CI
Discussion HbA1c reductions associated with SGLT2 may be smaller in those with reduced eGFR at baseline Empagliflozin is associated with larger HbA1c reductions than Dapagliflozin but no other significant differences noted Ongoing data collection: Increasing real-world use at lower eGFR levels Closer look at impact on other outcomes BP, weight/BMI
Questions? Want to learn more about the ABCD audit programmes: ABCD.care/ABCD-nationwide-audits Current audits: Oral and injectable Semaglutide OmniPod Closed-Loop DIY APS SGLT2 Testosterone
