Shine Literacy Project Feedback Meeting and Funding Acknowledgement
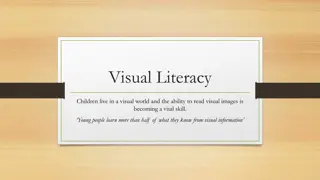
The Shine Literacy Project recently held its first feedback meeting, expressing gratitude to funding agencies like Infinity Foundation, Pub Charities, Porirua Foundation, and others. The project's origins, student achievement profiles, assessment methods, and outcomes were highlighted, showcasing the integration of literacy instruction at Titahi Bay School. Various assessment tools were identified, such as the British Picture Vocabulary Scale, Clay Word Reading, and Phonological Awareness Test. The project emphasizes improving reading and writing skills, narrowing achievement gaps, and enhancing literacy outcomes for students.

Download Presentation

Please find below an Image/Link to download the presentation.
The content on the website is provided AS IS for your information and personal use only. It may not be sold, licensed, or shared on other websites without obtaining consent from the author.If you encounter any issues during the download, it is possible that the publisher has removed the file from their server.
You are allowed to download the files provided on this website for personal or commercial use, subject to the condition that they are used lawfully. All files are the property of their respective owners.
The content on the website is provided AS IS for your information and personal use only. It may not be sold, licensed, or shared on other websites without obtaining consent from the author.
E N D
Presentation Transcript
Shine Literacy Project Thank you for attending tonight s first feedback meeting
Shine Literacy Project Thank you these agencies who have provided funding and support: Infinity Foundation Pub Charities Porirua Foundation Mana Community Grants TG McCarthy Trust Gilt Edge Publishing, MJA Publishing FRESCO
How the Project Started Percentage of Titahi Bay School students achieving at or above National Standards in 2012 Reading 79% 85% 62% 49% Writing 91% 89% 71% 60% Year 3*** Year 4** Year 5* Year 6 *** Three years of integrated literacy instruction Years 1-3 ** Two years of integrated literacy instruction Years 2 & 3 * One year of integrated literacy instruction Year 3
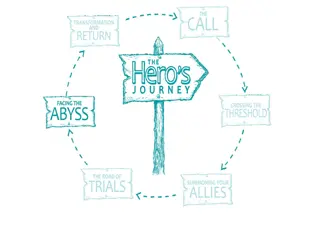
Achievement Profiles Pattern A Pattern B Pattern C Reading Achievement A Increasing achievement gap (Matthew Effect) B Decreasing achievement gap (compensatory model) C Stable achievement gap
Shine Literacy Project Assessments Used
Assessments Used Vocabulary Knowledge British Picture Vocabulary Scale Measures receptive vocabulary
Assessments Used Knowledge of Letter Names Upper and lower case
Assessments Used Clay Word Reading Reading 15 high-frequency words
Assessments Used Phonological Awareness Skills Sutherland Phonological Awareness Test - SPAT Syllables, rhyming, blending, segmenting, deleting sounds
Assessments Used Knowledge of Letter Sounds Upper and lower case
Assessments Used Sound to Letter knowledge The ability to write every sound of English
Assessments Used Invented Spelling Writing 18 words (a total of 54 sounds)made up of most of the sounds of English
Shine Literacy Project Cohort Characteristics
Cohort Characteristics Size The cohort size is 259 children. 112 (43.2%) are boys 147 (56.8%) are girls Trial group size: 138 71 Decile 9-10; 67 Decile 1-4 Comparison Group size: 121 69 Decile 10; 52 Decile 1-3
Cohort Characteristics Ethnicity 28 different ethnicities were recorded. These have been grouped into: Pakeha 46.3% Maori 21.2% Pasifika 18.5% Asian 11.6% European 1.5% Other 0.8%
Cohort Characteristics Decile Ranking 1 2 3 4 9 10 19.7% 15.1% 7.3% 3.9% 3.9% 50.2%
Cohort Characteristics Deciles by Ethnicity Deciles 1 & 2 44.4% Pasifika 36.7% Maori 11.1% Pakeha 6.7% Asian 1.1% Other Deciles 3 & 4 41.4% Pakeha 31% Maori 13.8% Pasifika 10.3% Asian 3.4% Other
Cohort Characteristics Deciles by Ethnicity Deciles 9 & 10 70% Pakeha 9.3% Maori 2.9% Pasifika 15% Asian 2.9% European
Shine Literacy Project Results
Results British Picture Vocabulary Scale There was no significant difference between the results for Comparison and Trial cohorts. Comparison Group Mean: Trial Group Mean: 98.64 99.75
Results There were significant differences comparing high and low decile groups in the Comparison and Trial cohorts: Comparison High Group Mean: 103.96 Comparison Low Group Mean: 91.58 Trial High Group Mean: Trial Low Group mean: 106.23 92.26
Results Results are now grouped in the following way: 1. Items where there was no change between Time 1 and Time 2 - Letter name knowledge (upper and lower case letters) - Clay Word Reading
Results Letter Names: Upper Case /26 25 20 15 Comparison Group Trial Group 10 5 0 Time 1 Time 2 Comparison Comparison Trial Trial Significance Significance Time 1 Time 2 Time 2 16.12 23.27 23.27 14.70 21.36 21.36 Sig (comp) Sig (comp) Sig (comp) Time 1 16.12 14.70 Sig (comp)
Results Letter Names: Lower Case /28 25 20 15 Comparison Group Trial Group 10 5 0 Time 1 Time 2 Comparison Comparison Trial Trial Significance Significance Time 1 Time 2 Time 2 15.17 23.80 23.80 13.37 21.84 21.84 Non Sig Sig (comp) Sig (comp) Time 1 15.17 13.37 Non Sig
Results Clay Word Reading /15 8 7 6 5 Comparison Trial Significance Comparison Group 4 Trial Group 3 Time 1 Time 2 1.53 6.90 .92 5.86 Non sig Non sig 2 1 0 Time 1 Time 2 Comparison Trial Significance Time 1 Time 2 1.53 6.90 .92 5.86 Non sig Non sig
Results Results are now grouped in the following way: 2. Items where there was a change in results with significantly higher results in Time 1 ceasingto be significant in Time 2. Sound-letter knowledge Letter sound knowledge (upper and lower case) Invented Spelling
Results In this category, the Trial group made statistically significant gains in progress for: Letter sound knowledge (upper and lower case) Invented Spelling SPAT
Results Sound to Letter /45 30 25 20 Comparison Group 15 Comparison 16.12 23.27 Trial 14.70 21.36 Significance Sig (comp) Sig (comp) Trial Group Time 1 Time 2 10 5 0 Time 1 Time 2 Comparison Trial Significance Time 1 Time 2 9.13 25.60 6.29 24.02 Sig (comp) Non Sig
Results Letter Sounds: Upper Case /26 25 20 15 Comparison Group 10 Trial Group 5 0 Time 1 Time 2 Comparison Trial Significance Comparison 11.45 19.58 Trial 7.50 18.48 Significance Sig (comp) Non Sig Time 1 Time 2 Time 1 Time 2 11.45 19.58 7.50 18.48 Sig (comp) Non Sig
Results Letter Sounds: Upper Case - by Decile Groups 25 20 Comparison High 15.42 23.27 Comparison Low 6.17 14.58 Trial High 10.99 21.23 Trial Low 3.39 15.38 Significance Comparison High 15 Time 1 Time 2 Trial High 10 Comparison Low Significance Trial Low Time 1 Time 2 5 0 Time 1 Time 2 Comparison High 15.42 23.27 Comparison Low 6.17 14.58 Trial High 10.99 21.23 Trial Low 3.39 15.38 Significance Time 1 Time 2 Significance Time 1 Time 2
Results Letter Sounds: Lower Case /28 25 20 Comparison High 15.42 23.27 Comparison Low 6.17 14.58 Trial High 10.99 21.23 Trial Low 3.39 15.38 Significance 15 Time 1 Time 2 Comparison Group 10 Trial Group Significance Time 1 Time 2 5 0 Time 1 Time 2 Comparison Trial Significance Time 1 Time 2 10.65 20.22 7.05 18.48 Sig (comp) Non Sig
Results Letter Sounds: Lower Case by Decile Group 30 25 20 Comparison High Comparison High 15.06 24.08 Comparison Low 4.81 15.00 Trial High 10.44 21.85 Trial Low 3.04 15.45 Significance Trial High 15 Time 1 Time 2 Comparison Low 10 Significance Trial Low Time 1 Time 2 5 0 Time 1 Time 2 Comparison High 15.06 24.08 Comparison Low 4.81 15.00 Trial High 10.44 21.85 Trial Low 3.04 15.45 Significance Time 1 Time 2 Significance Time 1 Time 2
Results Invented Spelling /54 30 25 20 Comparison Trial Significance Comparison Group 15 Trial Group Time 1 Time 2 7.28 28.33 3.54 28.49 Sig Non sig 10 5 0 Time 1 Time 2 Comparison Trial Significance Time 1 Time 2 7.28 28.33 3.54 28.49 Sig Non sig
Results Invented Spelling by Decile Groups 40 35 30 Comparison High 25 Comparison High 11.17 34.59 Comparison Low 2.16 19.86 Trial High 5.61 32.61 Trial Low 1.18 24.56 Significance Sig Non sig Significance Non sig Sig (Trial) Trial High Time 1 Time 2 20 Comparison Low 15 Trial Low 10 Time 1 Time 2 5 0 Time 1 Time 2 Comparison High 11.17 34.59 Comparison Low 2.16 19.86 Trial High 5.61 32.61 Trial Low 1.18 24.56 Significance Sig Non sig Significance Non sig Sig (Trial) Time 1 Time 2 Time 1 Time 2
Results SPAT: Sutherland Phonological Awareness Test 25 20 15 Comparison 12.75 21.62 Trial 11.23 22.17 Significance Non Sig Non sig Comparison Group Time 1 Time 2 10 Trial Group 5 0 Time 1 Time 2 Comparison 12.75 21.62 Trial 11.23 22.17 Significance Non Sig Non sig Time 1 Time 2
Results SPAT: Sutherland Phonological Awareness Test - by Decile Groups 30 25 20 Comparison High Comparison High 16.61 26.89 Comparison Low 7.78 14.49 Trial High 13.94 26.23 Trial Low 7.96 17.31 Significance Non Sig Non Sig Significance Non sig Borderline sig (Trial) Time 1 Time 2 Trial High 15 Comparison Low 10 Trial Low Time 1 Time 2 5 0 Time 1 Time 2 Comparison High 16.61 26.89 Comparison Low 7.78 14.49 Trial High 13.94 26.23 Trial Low 7.96 17.31 Significance Non Sig Non Sig Significance Non sig Borderline sig (Trial) Time 1 Time 2 Time 1 Time 2
Shine Literacy Project Questions and Comments
Summary: Achievement Profiles Pattern A Pattern B Pattern C Reading Achievement A Increasing achievement gap (Matthew Effect) B Decreasing achievement gap (compensatory model) C Stable achievement gap
Shine Literacy Project Ongoing Funding
Funding We have launched a Givealittle page to raise funds for the continuation of this project. Please let your school communities know about this via your newsletter. www.givealittle.co.nz/literacysuccess Thanks to Fraser Carson of FRESCO for setting this up for us.
Contact If you have any questions, comments or want to discuss the project further, please contact Joy: sus@ihug.co.nz 027 243 0827 www.literacysuccess.org.nz
Shine Literacy Project Thank you for attending tonight s presentation