Signal Classification: Multichannel, Continuous Signals & More
Explore the classification of signals, including multichannel and multidimensional signals, continuous-time versus discrete-time signals, deterministic versus random signals, periodic and non-periodic signals, and the concepts of discrete signals and analog signal sampling.

Download Presentation

Please find below an Image/Link to download the presentation.
The content on the website is provided AS IS for your information and personal use only. It may not be sold, licensed, or shared on other websites without obtaining consent from the author. If you encounter any issues during the download, it is possible that the publisher has removed the file from their server.
You are allowed to download the files provided on this website for personal or commercial use, subject to the condition that they are used lawfully. All files are the property of their respective owners.
The content on the website is provided AS IS for your information and personal use only. It may not be sold, licensed, or shared on other websites without obtaining consent from the author.
E N D
Presentation Transcript
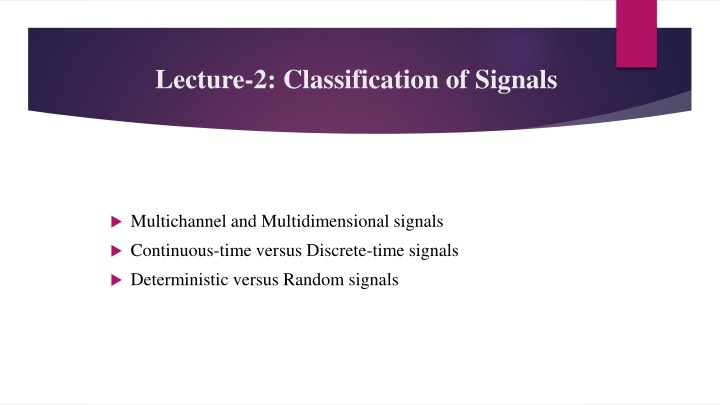
Lecture-2: Classification of Signals Multichannel and Multidimensional signals Continuous-time versus Discrete-time signals Deterministic versus Random signals
Multichannel and Multidimensional signals Multichannel Signals: Signals which are generated by multiple sources or multiple sensors are called multichannel signals. These signals are represented by vector S(t) = [(S1(t) S2(t) S3 (t)] Above signal represents a 3-channel signal. Multidimensional signals: A signal is called multidimensional signal if it is a function of M independent variables. For example : Speech signal is a one dimensional signal because amplitude of signal depends upon single independent variable, namely, time.
Continuous Signals Defined for every values of time. Take on values in the continuous interval ( a, b) where, a can be - and b can be Function of a continuous variable Example: x (t) = sin t
Periodic & Non-Periodic Signal Periodic Signal: A signal which completes a pattern within a measurable time frame, called a period and repeats that pattern over identical subsequent periods. The completion of a full pattern is called a cycle. A period is defined as the amount of time (expressed in seconds) required to complete one full cycle. The duration of a period represented by T. Also called deterministic signal.
Non-Periodic Signal Does not repeats its pattern over a period Can not represented by any mathematical equations Values can not be determined with certainty at any given point of time. Also called random signal.
Discrete Signal Defined only at discrete instants of time. A discrete-time sinusoidal signal may be expressed as, X(n) =Acos ?? + ? , < ? < --------------(1) where, n = Integer variable, A= Amplitude, ?= Frequency in radians/sample, ?= Phase in radian. ??? ? = 2 ? So the equation (1) becomes, X(n) =Acos 2 ?? + ? , < ? <
Sampling of Analog Signal Sampling: Conversion of a continuous- time signal into a discrete-time signal obtained by taking samples of the continuous-time signal at discrete-time instants. Now, X(n) =A??? 2 ??.? ? = A??? 2 ??(1/??) ? Here, T= Sampling Interval= 1/Fs for sample ? ??? ? = A??? 2 = A??? 2 ?? ? Where, F= Fundamental Frequency= cycles/s Fs= Sampling Frequency= samples/s f= Normalized frequency= cycles/ samples
Digital Signal Quantization: Conversion of a discrete-time continuous-valued signal into a discrete-time, discrete-valued (Digital) signal. 5.6 7.2 8.3 9.6 6 7 8 10 sampling, quantized value 5.6-6= -0.4 7.2-7= 0.2 8.3-8= 0.3 9.6-10= -0.4 Quantization Error Quantization Error
6 7 8 10 0110 0111 1000 1010 - 2?? ? = -? 2? 2?? = 1 ? 2? 2 ? 1 so, f 1 2 Or, F/FsType equation here. 1 2 2 Or, Fs 2? Fs 2? Nyquist Rate/ Sampling Theorem
Peak and Peak to Peak Voltage 1. 10 volt Peak 2. 20 volt peak to peak