Similarity and Dissimilarity Measures in Data Mining
This content covers similarity and dissimilarity measures, including numerical representations for data objects, simple attribute comparisons, Euclidean distance calculations, common properties of distances and similarities, and binary vector similarities. Explore concepts like Euclidean Distance, Triangle Inequality, and Simple Matching Coefficients in data analysis.

Uploaded on Apr 13, 2025 | 5 Views
Download Presentation

Please find below an Image/Link to download the presentation.
The content on the website is provided AS IS for your information and personal use only. It may not be sold, licensed, or shared on other websites without obtaining consent from the author.If you encounter any issues during the download, it is possible that the publisher has removed the file from their server.
You are allowed to download the files provided on this website for personal or commercial use, subject to the condition that they are used lawfully. All files are the property of their respective owners.
The content on the website is provided AS IS for your information and personal use only. It may not be sold, licensed, or shared on other websites without obtaining consent from the author.
E N D
Presentation Transcript
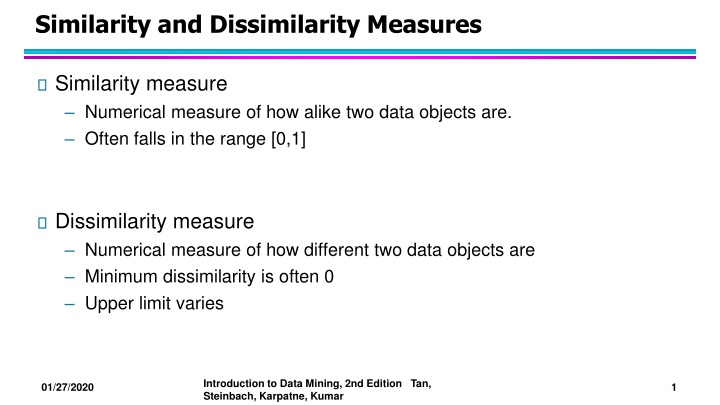
Similarity and Dissimilarity Measures Similarity measure Numerical measure of how alike two data objects are. Often falls in the range [0,1] Dissimilarity measure Numerical measure of how different two data objects are Minimum dissimilarity is often 0 Upper limit varies Introduction to Data Mining, 2nd Edition Tan, Steinbach, Karpatne, Kumar 01/27/2020 1
Similarity/Dissimilarity for Simple Attributes The following table shows the similarity and dissimilarity between two objects, x and y, with respect to a single, simple attribute. Introduction to Data Mining, 2nd Edition Tan, Steinbach, Karpatne, Kumar 01/27/2020 2
Euclidean Distance Euclidean Distance Introduction to Data Mining, 2nd Edition Tan, Steinbach, Karpatne, Kumar 01/27/2020 3
Euclidean Distance 3 point p1 p2 p3 p4 x 0 2 3 5 y 2 0 1 1 p1 2 p3 p4 1 p2 0 0 1 2 3 4 5 6 p1 p2 2.828 p3 3.162 1.414 p4 5.099 3.162 p1 p2 p3 p4 0 2.828 3.162 5.099 0 1.414 3.162 0 2 2 0 Distance Matrix Introduction to Data Mining, 2nd Edition Tan, Steinbach, Karpatne, Kumar 01/27/2020 4
Common Properties of a Distance Distances, such as the Euclidean distance, have some well known properties. 1. 2. 3. Positivity Symmetry Triangle Inequality Introduction to Data Mining, 2nd Edition Tan, Steinbach, Karpatne, Kumar 01/27/2020 5
Common Properties of a Similarity Similarities, also have some well known properties. s(x, y) = 1 (or maximum similarity) only if x= y. (does not always hold, e.g., cosine) s(x, y) = s(y, x) for all x and y. (Symmetry) 1. 2. where s(x, y) is the similarity between points (data objects), x and y. Introduction to Data Mining, 2nd Edition Tan, Steinbach, Karpatne, Kumar 01/27/2020 6
Similarity Between Binary Vectors Common situation is that objects, x and y, have only binary attributes Simple Matching and Jaccard Coefficients SMC = number of matches / number of attributes J = number of 11 matches / number of non-zero attributes Introduction to Data Mining, 2nd Edition Tan, Steinbach, Karpatne, Kumar 01/27/2020 7
SMC versus Jaccard: Example x = 1 0 0 0 0 0 0 0 0 0 y = 0 0 0 0 0 0 1 0 0 1 SMC = (f11 + f00) / (f01 + f10 + f11 + f00) = (0+7) / (2+1+0+7) = 0.7 J = (f11) / (f01 + f10 + f11) = 0 / (2 + 1 + 0) = 0 Introduction to Data Mining, 2nd Edition Tan, Steinbach, Karpatne, Kumar 01/27/2020 8
Cosine Similarity If d1 and d2 are two document vectors, then cos( d1, d2 ) = <d1,d2> / ||d1|| ||d2|| , Example: d1= 3 2 0 5 0 0 0 2 0 0 d2 = 1 0 0 0 0 0 0 1 0 2 <d1, d2>= 3*1 + 2*0 + 0*0 + 5*0 + 0*0 + 0*0 + 0*0 + 2*1 + 0*0 + 0*2 = 5 | d1 || = (3*3+2*2+0*0+5*5+0*0+0*0+0*0+2*2+0*0+0*0)0.5 = (42) 0.5 = 6.481 || d2 || = (1*1+0*0+0*0+0*0+0*0+0*0+0*0+1*1+0*0+2*2)0.5= (6) 0.5 = 2.449 cos(d1, d2 ) = 0.3150 Introduction to Data Mining, 2nd Edition Tan, Steinbach, Karpatne, Kumar 01/27/2020 9
Visually Evaluating Correlation Scatter plots showing the correlation from 1 to 1. Introduction to Data Mining, 2nd Edition Tan, Steinbach, Karpatne, Kumar 01/27/2020 10
Data Preprocessing Aggregation Sampling Dimensionality Reduction Feature subset selection Discretization and Binarization Attribute Transformation Introduction to Data Mining, 2nd Edition Tan, Steinbach, Karpatne, Kumar 01/27/2020 11
Aggregation Combining two or more attributes (or objects) into a single attribute (or object) Purpose Data reduction Change of scale More stable data Introduction to Data Mining, 2nd Edition Tan, Steinbach, Karpatne, Kumar 01/27/2020 12
Sampling Sampling is the main technique employed for data reduction. Entire set of data is too expensive or time consuming. Introduction to Data Mining, 2nd Edition Tan, Steinbach, Karpatne, Kumar 01/27/2020 13
Sample Size 8000 points 2000 Points 500 Points Introduction to Data Mining, 2nd Edition Tan, Steinbach, Karpatne, Kumar 01/27/2020 14
Types of Sampling Simple Random Sampling There is an equal probability of selecting any particular item Sampling without replacement Sampling with replacement Stratified sampling Split the data into several partitions; then draw random samples from each partition Introduction to Data Mining, 2nd Edition Tan, Steinbach, Karpatne, Kumar 01/27/2020 15
Curse of Dimensionality Definitions of density and distance between points, which are critical for clustering and outlier detection, become less meaningful Randomly generate 500 points Compute difference between max and min distance between any pair of points Introduction to Data Mining, 2nd Edition Tan, Steinbach, Karpatne, Kumar 01/27/2020 16
Dimensionality Reduction Purpose: Avoid curse of dimensionality Reduce amount of time and memory required by data mining algorithms Allow data to be more easily visualized May help to eliminate irrelevant features or reduce noise Techniques Principal Components Analysis (PCA) Singular Value Decomposition Others: supervised and non-linear techniques Introduction to Data Mining, 2nd Edition Tan, Steinbach, Karpatne, Kumar 01/27/2020 17
Dimensionality Reduction: PCA Goal is to find a projection that captures the largest amount of variation in data x2 e x1 Introduction to Data Mining, 2nd Edition Tan, Steinbach, Karpatne, Kumar 01/27/2020 18
Feature Subset Selection Another way to reduce dimensionality of data Redundant features Duplicate much or all of the information contained in one or more other attributes Irrelevant features Contain no information that is useful for the data mining task at hand Many techniques developed, especially for classification Introduction to Data Mining, 2nd Edition Tan, Steinbach, Karpatne, Kumar 01/27/2020 19
Discretization and Binarization Discretization is the process of converting a continuous attribute into an ordinal attribute Binarization maps a continuous or categorical attribute into one or more binary variables Introduction to Data Mining, 2nd Edition Tan, Steinbach, Karpatne, Kumar 01/27/2020 20
Attribute Transformation An attribute transform is a function that maps the entire set of values of a given attribute to a new set of replacement values such that each old value can be identified with one of the new values Simple functions: xk, log(x), ex, |x| Normalization Refers to various techniques to adjust to differences among attributes in terms of frequency of occurrence, mean, variance, range Take out unwanted, common signal, e.g., seasonality In statistics, standardization refers to subtracting off the means and dividing by the standard deviation Introduction to Data Mining, 2nd Edition Tan, Steinbach, Karpatne, Kumar 01/27/2020 21