Explore the concept of simple linear regression and correlation in statistics, where a linear relationship between variables is analyzed and predictions are made based on the regression analysis. Learn about intercept, slope, multiple regression, and the nature of regression data in practical applications.
Please find below an Image/Link to download the presentation.
The content on the website is provided AS IS for your information and personal use only. It may not be sold, licensed, or shared on other websites without obtaining consent from the author. If you encounter any issues during the download, it is possible that the publisher has removed the file from their server.
You are allowed to download the files provided on this website for personal or commercial use, subject to the condition that they are used lawfully. All files are the property of their respective owners.
The content on the website is provided AS IS for your information and personal use only. It may not be sold, licensed, or shared on other websites without obtaining consent from the author.
E N D
Presentation Transcript
Chapter 11 Simple Linear Regression and Correlation 503 STAT - Probability and Statistics for Engineers and Scientists Dr. Mansour Shrahili
Introduction: A reasonable form of a relationship between the response (dependent) independent variable, relationship Y and the the ? is linear where ?0 is the intercept and ?1 is the slope. The relationship is illustrated in the following figure. 503 STAT - Probability and Statistics for Engineers and Scientists Dr. Mansour Shrahili
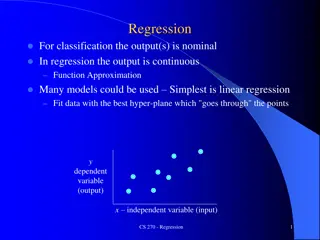
Regression Analysis: The concept of regression analysis deals with finding the best relationship between Y and X. Regression analysis measures the strength of the relationship, and allows for prediction of the response values Y for given values of the regressor X (x.) 503 STAT - Probability and Statistics for Engineers and Scientists Dr. Mansour Shrahili
In many applications, there will be more than one independent variable that helps to explain Y. For example: in the case where the response is the price of a house, one would expect the age of the house to contribute to the explanation of the price, so in this case the multiple regression structure might be written ? = ?0+ ?1?1+ ?2?2, where Y is price, ?1 is square footage, and ?2 is age in years. 503 STAT - Probability and Statistics for Engineers and Scientists Dr. Mansour Shrahili
The Simple Linear Regression Model In the above, ?0 and ?1 are unknown intercept and slope parameters, respectively, and ? is a random variable that is assumed to be distributed with E(?) = 0 and Var(?) = ?2. 503 STAT - Probability and Statistics for Engineers and Scientists Dr. Mansour Shrahili
Note: We must keep in mind that in practice ?0 and ?1are not known and must be estimated from data. We can only draw an estimated line. The following figure shows the nature of hypothetical (?,?) data scattered around a true regression line for a case in which only ? = 5 observations are available. 503 STAT - Probability and Statistics for Engineers and Scientists Dr. Mansour Shrahili
The Fitted Regression Line The Method of Least Squares 503 STAT - Probability and Statistics for Engineers and Scientists Dr. Mansour Shrahili
Example: Estimate the regression line for the pollution data of the following table And then, predict the value of y when x=30 503 STAT - Probability and Statistics for Engineers and Scientists Dr. Mansour Shrahili
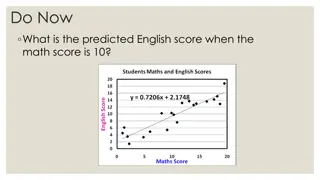
The scatter diagram for these data It can be seen from this scatter diagram that the points closely follow a straight line, indicating that the assumption of linearity between the two variables appears to be reasonable. 503 STAT - Probability and Statistics for Engineers and Scientists Dr. Mansour Shrahili
Solution: Prove that That is for x = 30, the fitted value of Y is: ? = ?? + ?1? = 3.8296 + 0.9036 30 = 30.9376 503 STAT - Probability and Statistics for Engineers and Scientists Dr. Mansour Shrahili
Analysis-of-Variance Approach Often the problem of analyzing the quality of the estimated regression line is handled by an analysis-of-variance (ANOVA) approach. The analysis of variance is a powerful resource that is used for many applications. Suppose that we have n experimental data points in the usual form ??,?? and that the regression line is estimated. In our estimation, we established the identity ???= ?1???+ ??? where ??? is called the total corrected sum of squares of y and SSE is called the sum of squares of the errors about the regression line. 503 STAT - Probability and Statistics for Engineers and Scientists Dr. Mansour Shrahili
An alternative and perhaps more informative formulation is ? ? ? ?? ?2= ?? ?2+ 2 ?? ?? ?=1 ?=1 ?=1 Then, we can obtain that SST=SSR+SSE where SSR is called the regression sum of squares. Suppose that we are interested in testing the hypothesis ?0:?1= 0 ?????? ?1:?1 0 where the null hypothesis, ?0, says that the model is ??|?= ?0. To test the hypotheses above, we compute ? =??? where ??? =??? ??? ??? ? 2 . 1 and ??? = 503 STAT - Probability and Statistics for Engineers and Scientists Dr. Mansour Shrahili
Reject ?0 at the level of significance when ? > ??1,? 2 . where ??1,? 2 is the critical value (tabulated value) of the F- distribution with degrees of freedoms 1= 1 and 2= n 2. (It is obtained from the F- table). ANOVA Table: Source of Variation (SV) Sum of Squares (SS) Degrees of Freedom (df) Mean Square (MS) F ??? ??? ??? =??? Regression SSR 1 1 ??? ? 2 Error SSE ? 2 ??? = Total SST ? 1 503 STAT - Probability and Statistics for Engineers and Scientists Dr. Mansour Shrahili
Computational Formulas: 503 STAT - Probability and Statistics for Engineers and Scientists Dr. Mansour Shrahili
Note: ?1=??? ??? or or 503 STAT - Probability and Statistics for Engineers and Scientists Dr. Mansour Shrahili
? ?? ?2 The regression sum of squares SSR= ?=1 or SSR = SST SSE or 503 STAT - Probability and Statistics for Engineers and Scientists Dr. Mansour Shrahili
Example: Using data in Example 11.1, the ANOVA table for testing ?1= 0 is: Source of Variation Sum of Squares Degrees of Freedom Mean Squares F SV (F- ratio = MSR/MSE) 325.08 SS df 1 31 32 MS = SS/df 3390.6 10.4 Regression Error Total 3390.6 323.3 3713.9 For testing: We can use the F-ratio: F= 325.08 For =0.05, the tabulated value ??1,? 2 =?0.051,31 4.17 Since the F-ratio = 325.08 >??1,? 2 , we reject ?0. 503 STAT - Probability and Statistics for Engineers and Scientists Dr. Mansour Shrahili