Explore how a new Dual Frequency Script enhances the JMP Time Series Analysis Platform, making it easier for analysts to model data containing multiple periodic signals. Follow along with the script demonstration on hourly power demand data for insights into forecasting and trend identification.
Please find below an Image/Link to download the presentation.
The content on the website is provided AS IS for your information and personal use only. It may not be sold, licensed, or shared on other websites without obtaining consent from the author. If you encounter any issues during the download, it is possible that the publisher has removed the file from their server.
You are allowed to download the files provided on this website for personal or commercial use, subject to the condition that they are used lawfully. All files are the property of their respective owners.
The content on the website is provided AS IS for your information and personal use only. It may not be sold, licensed, or shared on other websites without obtaining consent from the author.
E N D
Presentation Transcript
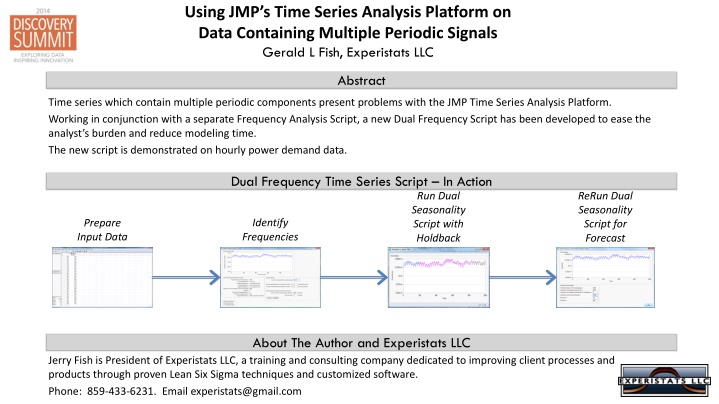
Using JMPs Time Series Analysis Platform on Data Containing Multiple Periodic Signals Gerald L Fish, Experistats LLC Abstract Time series which contain multiple periodic components present problems with the JMP Time Series Analysis Platform. Working in conjunction with a separate Frequency Analysis Script, a new Dual Frequency Script has been developed to ease the analyst s burden and reduce modeling time. The new script is demonstrated on hourly power demand data. Dual Frequency Time Series Script In Action ReRun Dual Seasonality Script for Forecast Run Dual Seasonality Script with Holdback Identify Frequencies Prepare Input Data About The Author and Experistats LLC Jerry Fish is President of Experistats LLC, a training and consulting company dedicated to improving client processes and products through proven Lean Six Sigma techniques and customized software. Phone: 859-433-6231. Email experistats@gmail.com
Prepare Input Data Hourly load data from PJME Website Pennsylvania/New Jersey/Maryland East First 1000 hrs of 2013 www.pjm.com/markets-and- operations/energy/real-time/loadhryr.aspx Return Return
Identify Frequencies of Interest Time Signal Frequency Spectrum Period1 = 24 hrs Period2 = 168 hrs Frequency Analysis Script by Experistats LLC (see JMP paper at 2014 JMP Discovery Summit) Return Return
Run JMP Script for Dual Frequency Time Series Analysis Blue = Original Data Pink = Fitted Model Green = Holdback Data Holdback 200 points to ensure good fit Input periods of interest (24 & 168 hrs) Fit appears good Return Return
Using JMPs Time Series Analysis Platform on Data Containing Multiple Periodic Signals Gerald L Fish Experistats LLC Blue = Original Data Pink = Fitted Model No Holdback Forecast 250 hrs beyond end of 1000 points Input periods of interest (24 & 168 hrs) Return Return