Simulation Analysis of ED Threshold Levels in IEEE 802.11-16/1451r0
Explore the impact of changing the Energy Detection (ED) threshold levels in IEEE 802.11 networks through simulation analysis. Results show the degradation in throughput for 802.11ax devices when transitioning to a lower ED threshold, while legacy devices experience performance improvements. The study delves into different scenarios and provides valuable insights for network optimization and device compatibility.
Download Presentation

Please find below an Image/Link to download the presentation.
The content on the website is provided AS IS for your information and personal use only. It may not be sold, licensed, or shared on other websites without obtaining consent from the author. If you encounter any issues during the download, it is possible that the publisher has removed the file from their server.
You are allowed to download the files provided on this website for personal or commercial use, subject to the condition that they are used lawfully. All files are the property of their respective owners.
The content on the website is provided AS IS for your information and personal use only. It may not be sold, licensed, or shared on other websites without obtaining consent from the author.
E N D
Presentation Transcript
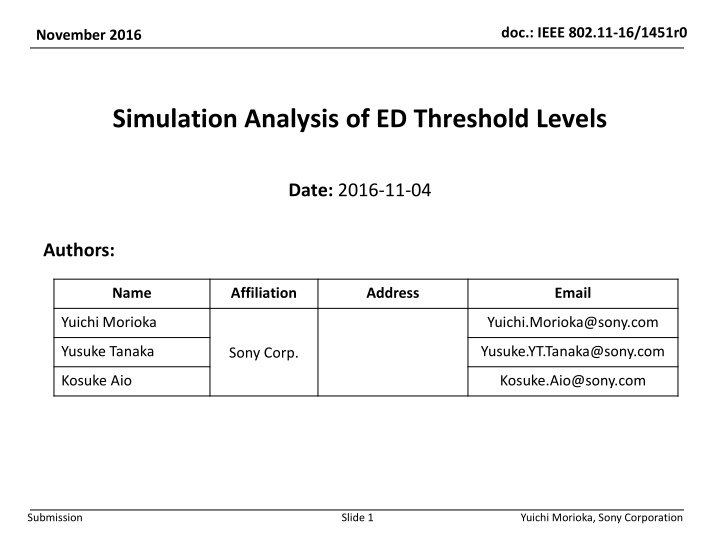
doc.: IEEE 802.11-16/1451r0 November 2016 Simulation Analysis of ED Threshold Levels Date: 2016-11-04 Authors: Name Affiliation Address Email Yuichi Morioka Yuichi.Morioka@sony.com Yusuke Tanaka Yusuke.YT.Tanaka@sony.com Sony Corp. Kosuke Aio Kosuke.Aio@sony.com Slide 1 Submission Yuichi Morioka, Sony Corporation
doc.: IEEE 802.11-16/1451r0 November 2016 Introduction IEEE 802.11 WG created the PDED ad hoc to consider potential response to 3GPP RAN1 s request to change 802.11 s ED threshold from -62[dBm] to -72[dBm] IEEE802.11-16/1291r0 [1] suggests three experiments (by simulation and/or testing) to provide the basis to respond to the request A) What happens if all 802.11 STAs uses ED of -72dBm B) What happens if some 802.11 STA uses ED of -72dBm C) What happens if both LAA UE and 802.11 STA operate at ED of -72dBm but with no PD communication In this presentation, we show system simulation results for B) in dense environment B) is a realistic in the presence of legacy 802.11 STAs Slide 2 Submission Yuichi Morioka, Sony Corporation
doc.: IEEE 802.11-16/1451r0 November 2016 Simulation Scenario SS3 (Indoor Small BSS defined in TGax) is used, as defined in [2] Half of STAs are 802.11ax STAs, other STAs are legacy 802.11 STAs. All APs are 802.11ax STAs. Num of Drops [times] 5 Traffic Model & Load & Duration Approximated CBR UDP traffic model DL ... 12.0 Mbps x 20 flow (IP 1000byte) UL ... 12.0 Mbps x 4 flow (IP 1000byte) Access Category AC_BE CWmin=15, CWmax=1023, AIFSN=3, TXOP limit=0 Tx Power [dBm] AP : 23dBm, STA : 15dBm MCS Selection SINR based (Tput maximizing) MCS selection Guard Interval short Packet Length [byte] (MPDU, MSDU, APP)=(1038, 1000, 972) Fixed L2 Retry 10 Ack Rate Legacy 6.0Mbps RTS/CTS OFF Max Aggregation Size (A-MPDU, A-MSDU)=(65535, NA) NF [dB] 7 Channel TGn Channel D (pathloss, shadowing, fading) Channel Setting [MHz] (CenterFreq, BW)=(5180, 80) CCA-SD [dBm] -82dBm CCA-ED [dBm] Parameters No Wrap Around. Cell =10m Freq. Reuse=3 Det. Cancel on PLCP err Enable (Probability is based on Box5) BSS COLOR operation Enable, OBSS-PD = -82dBm Slide 3 Submission Yuichi Morioka, Sony Corporation
doc.: IEEE 802.11-16/1451r0 November 2016 Simulation Results Ave. Throughput per BSS 25.0 Ave. UL+DL Throughput per BSS 20.0 15.0 [Mbps] 10.0 5.0 0.0 (A) 802.11ax devices use ED = -62dBm, and Legacy 802.11 devices use ED = -62dBm 18.8 19.6 (B) 802.11ax devices use ED = -72dBm, and Legacy 802.11 devices use ED = -62dBm 11.8 23.0 11ax Legacy Performance of 11ax STAs significantly degrade if the ED threshold is changed to -72dBm For 802.11ax STAs, throughput decreases to 63% For legacy 802.11 STAs, throughput increases to 117% Slide 4 Submission Yuichi Morioka, Sony Corporation
doc.: IEEE 802.11-16/1451r0 November 2016 Simulation Results CDF of UL Throughput 1 802.11ax STAs in (A) Legacy 802.11 STAs in ((A) 802.11ax STAs in (B) CDF (UpLink) Legacy 802.11 STAs in (B) 0.1 5% tile (A) 802.11ax devices use ED = -62dBm, Legacy 802.11 devices use ED = -62dBm (B) 802.11ax devices use ED = -72dBm, Legacy 802.11 devices use ED = -62dBm 0.01 0.10 1.00 10.00 Throughput per Flow [Mbps] Performance of 11ax STAs significantly degrade if the ED threshold is changed to -72dBm For 802.11ax STAs, 5% tile throughput decreases to 82% For legacy 802.11 STAs, 5% tile throughput increases to 530% Slide 5 Submission Yuichi Morioka, Sony Corporation
doc.: IEEE 802.11-16/1451r0 November 2016 Simulation Results Air Time Ratio <802.11ax STAs> <Legacy 802.11 STAs> Performance of 11ax STAs significantly degrade if the ED threshold is changed to -72dBm For 802.11ax STAs, effective air time ratio decreases to 52% For legacy 802.11 STAs, effective air time ratio increases to 122% Slide 6 Submission Yuichi Morioka, Sony Corporation
doc.: IEEE 802.11-16/1451r0 November 2016 Conclusion In this contribution, we proposed to reject 3GPP RAN1 s request to change 802.11 s ED threshold from -62dBm to -72dBm As it is not realistic to change legacy STAs behavior, we analyzed case B) some 802.11 STA uses ED of -72dBm , where 802.11ax STAs use the new threshold In this coexistence scenario, performance of 802.11ax STAs significantly degrade, hence the request to change all new 802.11 STAs to adopt the new threshold should be rejected Further analysis should be conducted for adjustable ED threshold according to transmission power, as defined in 3GPP LAA Slide 7 Submission Yuichi Morioka, Sony Corporation
doc.: IEEE 802.11-16/1451r0 November 2016 References [1] 11-16-1291-00-0000-pded-ad-hoc-agenda-27-sept-2016 [2] 11-14-0980-16-00ax-simulation-scenarios [3] 11-14-0571-12-00ax-evaluation-methodology Slide 8 Submission Yuichi Morioka, Sony Corporation

