Simulation-Based Evaluation of DSC in Residential Scenario
This document from January 2015 explores the performance of DSC in dense WLAN networks using the NS-3 simulator. It investigates the impact of DSC cells on legacy cells and provides recommendations for DSC algorithm parameters.

Download Presentation

Please find below an Image/Link to download the presentation.
The content on the website is provided AS IS for your information and personal use only. It may not be sold, licensed, or shared on other websites without obtaining consent from the author.If you encounter any issues during the download, it is possible that the publisher has removed the file from their server.
You are allowed to download the files provided on this website for personal or commercial use, subject to the condition that they are used lawfully. All files are the property of their respective owners.
The content on the website is provided AS IS for your information and personal use only. It may not be sold, licensed, or shared on other websites without obtaining consent from the author.
E N D
Presentation Transcript
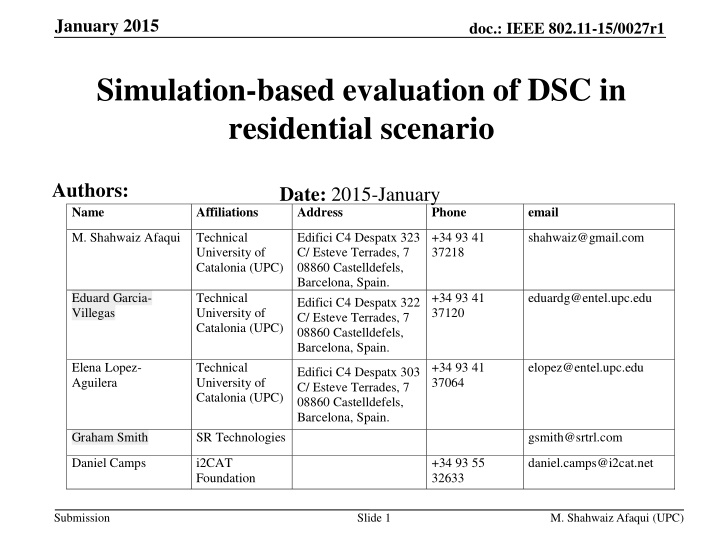
January 2015 doc.: IEEE 802.11-15/0027r1 Simulation-based evaluation of DSC in residential scenario Authors: Name Date: 2015-January Address Affiliations Phone email M. Shahwaiz Afaqui Technical University of Catalonia (UPC) Edifici C4 Despatx 323 C/ Esteve Terrades, 7 08860 Castelldefels, Barcelona, Spain. Edifici C4 Despatx 322 C/ Esteve Terrades, 7 08860 Castelldefels, Barcelona, Spain. +34 93 41 37218 shahwaiz@gmail.com Eduard Garcia- Villegas Technical University of Catalonia (UPC) +34 93 41 37120 eduardg@entel.upc.edu Elena Lopez- Aguilera Technical University of Catalonia (UPC) +34 93 41 37064 elopez@entel.upc.edu Edifici C4 Despatx 303 C/ Esteve Terrades, 7 08860 Castelldefels, Barcelona, Spain. Graham Smith SR Technologies i2CAT Foundation gsmith@srtrl.com Daniel Camps +34 93 55 32633 daniel.camps@i2cat.net Submission Slide 1 M. Shahwaiz Afaqui (UPC)
January 2015 doc.: IEEE 802.11-15/0027r1 Outline 1. 2. 3. 4. 5. 6. 7. 8. 9. Context Simulation Environment: NS-3 DSC algorithm Simulation scenarios and assumptions Metrics used for evaluation Selection of suitable parameters for DSC Combining DSC with channel selection and rate control Hybrid case A: Impact of DSC cells over legacy cells Hybrid case B: Impact of DSC nodes over legacy nodes within cells Worst case scenario (MCS0 & packet size of 1500 bytes) Conclusions/next steps References Appendix 10. 11. 12. 13. Submission Slide 2 M. Shahwaiz Afaqui (UPC)
January 2015 doc.: IEEE 802.11-15/0027r1 1. Context One of the main objectives of IEEE 802.11ax standards is to improve efficiency in scenarios with high density of AP and non-AP stations by, increasing spectral frequency reuse. managing interference in OBSS. It has been shown in previous presentations[1-11] that the use of DSC can increase the per-user throughput in dense scenarios. In this submission we, investigate the performance of DSC, NS-3 simulator is used to measure the performance of DSC in dense WLAN network that contains multiple OBSS. recommend parameters to be employed for DSC algorithm. study the impact of DSC cells over legacy cells. Submission Slide 3 M. Shahwaiz Afaqui (UPC)
January 2015 doc.: IEEE 802.11-15/0027r1 2. Simulation Environment: NS-3 (1/2) NS-3 is a simulator for Internet systems, It allows the study of protocols and network performance of large-scale systems in a controlled and scalable environment. Main characteristics, Discrete event simulator Packet level simulator (layer 2 and above) Layered architecture Free and open source Frequent updates ( latest version ns 3.21- release date 17-09-2014) Large number of protocol implementations and models available, TCP, UDP IPV4, IPV6, static routing IEEE 802.11 and variants, WiMAX, LTE IEEE 802 physical layer Mobility models and routing protocols Ability to design indoor, outdoor or hybrid networks etc. Submission Slide 4 M. Shahwaiz Afaqui (UPC)
January 2015 doc.: IEEE 802.11-15/0027r1 2. Simulation Environment: NS-3 (2/2) Limitations Simple PHY layer abstraction MPDU aggregation is not yet implemented and thus not used within these simulations. IEEE 802.11ac model has not yet been developed and current results focus on IEEE 802.11g/n. Challenges dense WLAN scenario with multiple OBSS generated in NS-3 where the simulation package is modified to, allow STAs to measure the energy level of received beacon frames. improve hybrid building pathloss model to accommodate floor penetration losses. modifications /new additions made to accommodate real time operation of DSC algorithm. Submission Slide 5 M. Shahwaiz Afaqui (UPC)
January 2015 doc.: IEEE 802.11-15/0027r1 3. DSC algorithm DSC varies CST levels at each station in a distributed manner, stations near their respective AP can have higher CST because interference from concurrent transmissions would have limited implications. stations further away can have lower CST because the probability of correct transmissions can be increased by reducing the presence of hidden nodes. Flow chart highlights the basic operation of DSC algorithm over non- AP stations in an infrastructure-based WLAN. Submission Slide 6 M. Shahwaiz Afaqui (UPC)
January 2015 doc.: IEEE 802.11-15/0027r1 4. Simulation scenarios and assumptions (1/2) Topology multi-floor residential building, 5 stories 2 10 apartments per story. Apartment size: 10m 10m 3m. 1 AP placed randomly in each apartment at 1.5m height. channel selected randomly for each cell. Three channel scheme (1, 6, 11) ~1/3 of the cells share the same channel 5 STAs placed randomly around their respective AP. Submission Slide 7 M. Shahwaiz Afaqui (UPC)
January 2015 doc.: IEEE 802.11-15/0027r1 4. Simulation scenarios and assumptions (1/2) Frequency band: focused on 2.4GHz , Intended to investigate the impact of DSC in a band that is more restricted in dense environments. Traffic: UDP CBR uplink transmission in saturation conditions is considered, Worst case in terms of contention. Pathloss model: Hybrid Building Propagation loss model [12], obtained through a combination of several well known pathloss including indoor (through walls, floors) and outdoor (urban, suburban, open). We simulated hundreds of random scenarios with and without utilizing the DSC. Additional simulation details are provided in the appendix. Submission Slide 8 M. Shahwaiz Afaqui (UPC)
January 2015 doc.: IEEE 802.11-15/0027r1 5. Metrics used for evaluation Aggregate throughput and STA s individual throughput Frame Error Rate (FER) ratio of data frames received with errors to total data frames received. Fairness calculated according to Jain s fairness index [13]. Number of hidden nodes Hidden node: detected when a node that is located outside the sensing range of the transmitter is able to interfere in the ongoing transmission from the transmitter to the receiver. A pair of hidden nodes (e.g. T1 and T2) is considered a single entry. T1 R T2 Number of exposed nodes Exposed node: detected when a node is needlessly silenced to concurrently transmit, even though the node is not able to generate ample interference that could cause collisions at the receiver. A pair of exposed nodes (e.g. T1 and T2) is considered a single entry. T1 R2 R2 T2 Submission Slide 9 M. Shahwaiz Afaqui (UPC)
January 2015 doc.: IEEE 802.11-15/0027r1 6. Selection of suitable parameters for DSC (1/2) 16 RSSIDEC=4 RSSIDEC=5 RSSIDEC=6 18 RSSIDEC=4 RSSIDEC=5 RSSIDEC=6 % Increase in throughput 14 16 % Increase in fairness 14 12 12 10 10 8 8 6 6 4 4 2 2 0 0 5 10 15 20 25 5 10 15 20 25 Margin Margin Observations: throughput results indicate around 10 % improvement for all the cases over the conventional IEEE 802.11 protocol. maximum fairness benefits were achieved when lower values of Margin are used. Conclusions: the proposed algorithm increases the aggregate throughput along with fairness. Submission Slide 10 M. Shahwaiz Afaqui (UPC)
January 2015 doc.: IEEE 802.11-15/0027r1 6. Selection of suitable parameters for DSC (2/2) 30 500 RSSIDEC=4 RSSIDEC=5 RSSIDEC=6 RSSIDEC=4 RSSIDEC=5 RSSIDEC=6 % Increase in hidden nodes 450 25 400 % Increase in FER 350 20 300 15 250 200 10 150 100 5 50 0 0 5 10 15 20 25 5 10 15 20 25 Margin Margin Observations: higher values of Margin and RSSIDec result in smaller FER degradation. at higher Margin values, the increase in hidden nodes is smaller. the presence of exposed nodes is driven to 0 by the DSC algorithm. Conclusions: a consequence of the increased number of hidden nodes, the overall FER in network is increased larger access delay. Margin of 20dB and RSSIDec of 6dB are observed to create a balance between the negative and positive aspects of DSC Submission Slide 11 M. Shahwaiz Afaqui (UPC)
January 2015 doc.: IEEE 802.11-15/0027r1 7. Combining DSC with channel selection and rate control (1/2) RCHS+FMCS OPCHS+FMCS RCHS+RMCS OPCHS+RMCS 35 1 % Increase in throughput Without DSC With DSC 30 0.9 25 Fairness 0.8 20 15 0.7 10 0.6 5 0 0.5 RCHS+FMCS OPCHS+FMCS RCHS+RMCS OPCHS+RMCS Observations: scenarios where DSC is combined with optimal channel selection provide maximum throughput gains of more than 20%. DSC has more room for improvement when MCS is set randomly. Fairness and throughput increased in all the scenarios when DSC is used. Conclusions: Optimal channel selection has slightly larger impact on performance than DSC DSC increases the aggregate throughput by fairly increasing throughput over all the nodes. Slide 12 Submission M. Shahwaiz Afaqui (UPC)
January 2015 doc.: IEEE 802.11-15/0027r1 7. Combining DSC with channel selection and rate control (2/2) RCHS+FMCS OPCHS+FMCS RCHS+RMCS OPCHS+RMCS 0.5 180 Without DSC With DSC 160 % Increase in hidden nodes 0.4 140 120 0.3 100 FER 80 0.2 60 40 0.1 20 0 0 RCHS+FMCS OPCHS+FMCS RCHS+RMCS OPCHS+RMCS Observations: FER is slightly improved when optimal channel selection is used along with DSC. % increase in hidden nodes is smaller while utilizing optimal channel selection. with random channel selection, the increase in hidden nodes is around 150%. ~100% decrease in the number of exposed nodes is witnessed for all the cases. Conclusions: the effect of increased FER and number of hidden nodes due to DSC can be reduced while utilizing optimal channel selection along with DSC. Submission Slide 13 M. Shahwaiz Afaqui (UPC)
January 2015 doc.: IEEE 802.11-15/0027r1 8. Hybrid case A: Impact of DSC cells over legacy cells (1/3) 4.5 0.75 4.0 Average throughput per node All cells DSC cells non-DSC cells 0.72 3.5 Average fairness 3.0 0.69 2.5 2.0 0.66 1.5 1.0 0.63 0.5 0.60 0.0 0 20 40 60 80 100 0 20 40 60 80 100 % of DSC cells % of DSC cells Observations: average throughput of DSC cells increases over the cost of decrease in average throughput of non-DSC cells. throughput gains for DSC cells are more evident in hybrid scenarios (i.e. DSC + non-DSC cells) . average fairness in the network increases with the inclusion of DSC enabled cells. Conclusions: overall average throughput and fairness are increased within the hybrid network due to DSC, Legacy cells/devices become less competitive. Submission Slide 14 M. Shahwaiz Afaqui (UPC)
January 2015 doc.: IEEE 802.11-15/0027r1 8. Hybrid case A: Impact of DSC cells over legacy cells (2/3) 0.45 All cells DSC cells non-DSC cells 0.40 0.35 Average FER 0.30 0.25 0.20 0.15 0.10 0.05 0.00 0 20 40 60 80 100 % of DSC cells Observation: average FER of DSC cells increases whereas the FER of non-DSC cells remains approximately consistent. Conclusion: overall FER in the network increases with the increase in DSC cells. Submission Slide 15 M. Shahwaiz Afaqui (UPC)
January 2015 doc.: IEEE 802.11-15/0027r1 8. Hybrid case A: Impact of DSC cells over legacy cells (3/3) 100 180 % decrease in exposed nodes % increase in hidden nodes 160 80 140 120 60 100 80 40 60 40 20 20 0 0 20 40 60 80 100 20 40 60 80 100 % of DSC cells % of DSC cells Observations: % increase in hidden nodes is greater for more number of DSC cells. maximum % decrease in exposed nodes is witnessed when all cells are DSC enabled. Conclusions: the FER in the network is increased due to increased number of hidden nodes. DSC increases fairness in the network by reducing the number of exposed nodes. Submission Slide 16 M. Shahwaiz Afaqui (UPC)
January 2015 doc.: IEEE 802.11-15/0027r1 9. Hybrid case B: Impact of DSC nodes over legacy nodes within cells (1/3) 6 0.8 Average throughput per node All nodes DSC nodes Non-DSC nodes 0.7 5 Average fairness 0.6 4 0.5 3 0.4 0.3 2 0.2 1 0.1 0 0 0 20 40 60 80 100 0 20 % of nodes using DSC per cell 40 60 80 100 % of nodes using DSC per cell Observations: average throughput of DSC nodes increases over the cost of decrease in throughput of non-DSC nodes. throughput gains for DSC nodes are more evident than performance losses for non-DSC nodes. average fairness in the network was reduced for some hybrid scenarios (20% to 60% DSC nodes). Conclusions: overall average throughput of the network is increased due to DSC, at the cost of noticeable performance degradation for legacy devices. Submission Slide 17 M. Shahwaiz Afaqui (UPC)
January 2015 doc.: IEEE 802.11-15/0027r1 9. Hybrid case B: Impact of DSC nodes over legacy nodes within cells (2/3) 0.50 0.45 All nodes DSC nodes non-DSC nodes 0.40 0.35 Average FER 0.30 0.25 0.20 0.15 0.10 0.05 0.00 0 20 40 60 80 100 % of nodes using DSC per cell Observation: average FER of both DSC and non-DSC nodes increases with an increased number of DSC nodes. Conclusion: overall FER in the network (for all nodes) increases with the increase in DSC enabled nodes. Submission Slide 18 M. Shahwaiz Afaqui (UPC)
January 2015 doc.: IEEE 802.11-15/0027r1 9. Hybrid case B: Impact of DSC nodes over legacy nodes within cells (3/3) 180 100 % decrease in exposed nodes % increase in hidden nodes 160 80 140 120 60 100 80 40 60 40 20 20 0 0 20 40 60 80 100 20 40 60 80 100 % of nodes using DSC per cell % of nodes using DSC per cell Observations: % increase in hidden nodes is greater for more number of DSC nodes. for the hybrid scenario, the % increase in hidden nodes is less than the case where all nodes are DSC enabled within a cell. maximum % decrease in exposed nodes is witnessed when all cells utilize DSC. Conclusions: due to increased number of hidden nodes, the FER in the network is increased. DSC increases fairness in the network by reducing the number of exposed nodes. Submission Slide 19 M. Shahwaiz Afaqui (UPC)
January 2015 doc.: IEEE 802.11-15/0027r1 10. Worst case scenario (MCS0 & packet size of 1500 bytes) (1/2) 1.0 40 MCS0+ps1500+RCHS MCS0+ps1500+OPCHS Without DSC With DSC % increase in throughput 0.9 30 0.8 Fairness 20 0.7 10 0.6 0 0.5 MCS0+ps1500+RCHS MCS0+ps1500+OPCHS Observations: scenario where DSC is combined with optimal channel selection provides maximum throughput gains of around 35%. fairness is increased in all the scenarios when DSC is used. Conclusions: DSC increases the aggregate throughput by fairly increasing throughput over all the nodes. % increase in throughput for DSC plus optimal channel selection cells is considerable even under difficult network conditions. Submission Slide 20 M. Shahwaiz Afaqui (UPC)
January 2015 doc.: IEEE 802.11-15/0027r1 10. Worst case scenario (MCS0 & packet size of 1500 bytes) (2/2) MCS0+ps1500 0.5 100 MCS0+ps1500+OPCHS Without DSC With DSC % increase in hidden nodes 90 0.4 80 70 60 0.3 FER 50 40 0.2 30 20 0.1 10 0 0.0 MCS0+ps1500+RCHS MCS0+ps1500+OPCHS Observations: difference of average FER per node between DSC enabled and legacy nodes is notable when optimal channel selection is utilized. % increase in hidden nodes is less while utilizing optimal channel selection. almost 100% decrease in the number of exposed nodes is witnessed for all the cases. Conclusions: relatively small difference in FER is observed between the network consisting of optimal channel selection and random channel selection. optimal channel selection helps to reduce the number of hidden nodes. Slide 21 Submission M. Shahwaiz Afaqui (UPC)
January 2015 doc.: IEEE 802.11-15/0027r1 11. Conclusions/next steps DSC scheme provides improvements in throughput and fairness in all cases Based on the reduction of exposed nodes DSC also increases number of hidden nodes and FER. DSC makes more sense (i.e. provides larger improvements) in worse conditions Higher contention Slower STAs Margin of 20 and RSSIDec of 6 are observed to create a balance between the negative and positive aspects of DSC. Channel selection and rate control can improve the positive effects of DSC scheme. For Hybrid case A (DSC cells vs non-DSC cells): notable throughput gains for DSC cells at the cost of slight degradation for non-DSC cells. For Hybrid case B (DSC STAs vs. non-DSC STAs in the same cell): fairness results indicate the coexistence problem between DSC and legacy IEEE 802.11 nodes within the cells. Next steps, Repeat study in different scenarios. Analyze the impact of DSC in uplink plus downlink traffic. Study the effects of DSC algorithm over a network operating in 5GHz. Submission Slide 22 M. Shahwaiz Afaqui (UPC)
January 2015 doc.: IEEE 802.11-15/0027r1 12. References 1) Graham Smith, DSP Group, 11-13-1290-01 Dynamic Sensitivity Control for HEW 2) Graham Smith, DSP Group, 11-13-1487-02 Dense Apartment Complex Capacity Improvements with Channel selection and Dynamic Sensitivity Control 3) Graham Smith, DSP Group, 11-13-1489-05 Airport Capacity Analysis 4) Graham Smith, DSP Group, 11-14-0045-02 E-Education Analysis 5) Graham Smith, DSP Group, 11-14-0058-01 Pico Cell Use Case Analysis 6) Graham Smith, DSP Group, 11-14-0294-02 Dynamic Sensitivity Control Channel Selection and Legacy Sharing 7) Graham Smith, DSP Group, 11-14-0365-01 Dynamic Sensitivity Control Implementation 8) Graham Smith, DSP Group, 11-14-0328-02 Dense Apartment Complex Throughput Calculations 9) Graham Smith, DSP Group, 11-14-0779-00 Dynamic Sensitivity Control Practical Usage 10) Imad Jamil, Orange, 11-14-0523-00 Mac Simulation Results for DSC and TPC 11) William Carney, Sony, 11-14-0854-00 DSC and Legacy Coexistence 12) Hybrid buildings propagation loss model: ns3-design document. [Online]. Available: http://www.nsnam.org/docs/models/html/buildingsdesign.html 13) J. R., Fairness: How to measure quantitatively? ATM Forum/94-0881, Sept. 1994. Submission Slide 23 M. Shahwaiz Afaqui (UPC)
January 2015 doc.: IEEE 802.11-15/0027r1 13. Appendix Submission Slide 24 M. Shahwaiz Afaqui (UPC)
January 2015 doc.: IEEE 802.11-15/0027r1 Simulation assumptions PHY parameters Parameters4 Values Parameters Values Wireless Standard IEEE 802.11g and IEEE 802.11n Packet size 1000bytes Frequency band 2.4 GHz STA TX power 16dBm Physical transmission rate for IEEE 802.11g 24Mbps Transmission gain 1dB Physical transmission rate for IEEE 802.11n i. ii. iii. 7.2Mbps 28.9Mbps 72.2Mbps Reception gain 1dB Channel width 20MHz Noise figure 7dB Propagation delay model Constant speed propagation delay Energy detection threshold -78dBm Propagation loss model Hybrid buildings propagation loss Initial CCA threshold -80dBm Wall penetration loss 12dB Guard interval Short Floor penetration loss 17dB Data preamble Short Submission Slide 25 M. Shahwaiz Afaqui (UPC)
January 2015 doc.: IEEE 802.11-15/0027r1 MAC parameters Parameters Values Parameters Values Access protocol EDCA Retransmission attempts 16 RTS/CTS Disabled Maximum missed beacons for re-association 10000 Association 100% STAs associated to AP in an Apartment Active probing Disabled QOS Enabled Traffic model Best effort Aggregation Disabled Simulation parameters Parameters Values Parameters Values Simulation time 25 seconds Simulations for each hybrid case 24 Confidence interval 95% Simulations for non-DSC network 24 Submission Slide 26 M. Shahwaiz Afaqui (UPC)