Sine and Cosine Graph Characteristics
Discover the parent graphs of sine and cosine functions and learn how to identify and graph them. Explore transformations, characteristics, and equations of trig functions to deepen your understanding.

Download Presentation

Please find below an Image/Link to download the presentation.
The content on the website is provided AS IS for your information and personal use only. It may not be sold, licensed, or shared on other websites without obtaining consent from the author.If you encounter any issues during the download, it is possible that the publisher has removed the file from their server.
You are allowed to download the files provided on this website for personal or commercial use, subject to the condition that they are used lawfully. All files are the property of their respective owners.
The content on the website is provided AS IS for your information and personal use only. It may not be sold, licensed, or shared on other websites without obtaining consent from the author.
E N D
Presentation Transcript
Graphing Sine and Cosine Section 4.5
Objectives Students will be able to Use the unit circle to generate the parent graphs of sine and cosine Recognize the sine and cosine parent graphs by their shape Graph the sine and cosine functions using transformations Determine all characteristics given the equation (amplitude, phase shift, vertical shift) Determine starting point and ending point of graph (5 points labeled on x-axis 1 cycle) Write the equation given the characteristics of the trig function or the graph
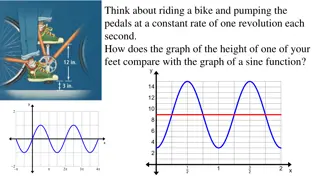
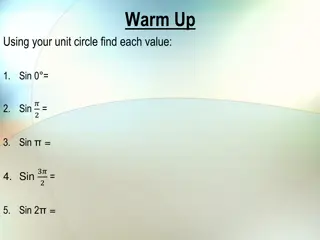
Discovery Today, you are going to discover what the graphs of sine and cosine look like. Complete the table of values given to you using your Unit Circle. Plot those points on a graph and connect the dots. Enter your values into the stat plot on your calculator and plot the scatterplot. Go to stat, calc, sinreg. Does your graph match the one on the calculator?
This is what you SHOULD have gotten! 1. y = sin x Graph 2. y = cos x
Angle (degrees) Value Cos Angle (degrees) Value Sin 0 0 30 30 45 45 60 60 90 90 120 120 135 135 150 150 180 180 210 210 225 225 240 240 270 270 300 300 315 315 330 330 360 360 390 390 405 405 420 420 450 450 480 480 495 495 510 510 540 540
Changing the Graph Just like any other parent graph, we can shift and change this graph in any way that we want. First though, what is the domain and range of our parent functions? What is the period of the graphs? What is the amplitude?
? ?(?(? ?)) + ? Again, using the same equation as before to shift the graph. Let s see what happens when we change these letters. Graphs!
What Does Each Parameter Do? General form a stands for _____________ Makes graph ___________ or _____________. b determines the ______________ b>1 period _____________ 0<b<1 period _____________ c moves the graph __________ or __________. C<0 graph moves _____________. C>0 graph moves ______________. d moves graph ______ or _________. d>0 moves graph _________. d<0 moves graph __________. = bx c + sin( ) y a d
To Graph Procedures: 1. Find the 2. Graph the 3. Use amplitude to graph the 4. Adjust for a) And then for 5. Plot the a) Then
PRACTICE!! 1. ? = 2sin? 2. ? = 2cos? + 3 1 2? + 4 3. ? = sin(2?) 4. ? = cos 6. ? = cos ? +? 5. ? = sin ? 90 4
When would I use this? x(month) y(temperature) The normal monthly temperature Jan 21 in degrees Fahrenheit in Albany, NY, Mar 34 for six months are given in the table. May 58 Jul 72 Create a scatterplot of the data. Sept 61 Nov 40
How? Find a trigonometric model that fits the data. Steps to follow: Enter your data in LIST Check your WINDOW settings to make sure your values will be seen in the viewing window Turn on Plot1 STAT CALC SinReg This will give you the values for the sine curve created by the data To graph the sine function created Y= VARS Statistics EQ RegEq GRAPH
What is the period of the model? Find the normal temperature in December. A painting company will accept exterior jobs only when the normal temperature is 64 degrees or higher. During what month will this company accept exterior jobs?
Closure On Post It Note: Identify the amplitude, period and 5 critical points ? =1 2sin ? ? 3
Homework Worksheet 4.5 (identify amplitude, period and 5 critical points) No Graphing (yet!)


) + ?")