Sine and Cosine Graphs in Advanced Math
Explore the concepts of periodic graphs, sine and cosine functions, oscillation, amplitude, and periods in this advanced math topic. Learn how to graph sine and cosine functions, understand their properties, periods, and amplitudes. Discover the similarities and differences between sine and cosine graphs and how to interpret their behavior. Dive into the world of mathematics with these captivating graphs and functions.

Download Presentation

Please find below an Image/Link to download the presentation.
The content on the website is provided AS IS for your information and personal use only. It may not be sold, licensed, or shared on other websites without obtaining consent from the author. If you encounter any issues during the download, it is possible that the publisher has removed the file from their server.
You are allowed to download the files provided on this website for personal or commercial use, subject to the condition that they are used lawfully. All files are the property of their respective owners.
The content on the website is provided AS IS for your information and personal use only. It may not be sold, licensed, or shared on other websites without obtaining consent from the author.
E N D
Presentation Transcript
Advanced Math-Honors Graphing Sine and Cosine
General Graphs Graphs are collections of points Independent variables are related to dependent variables Domain is set of independent variable values Range is set of dependent variable values
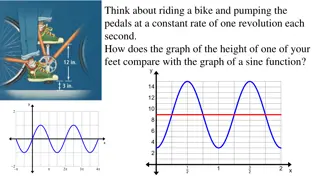
Periodic Graphs Graphs that repeat infinitely in intervals are called periodic Ex: Sea level as a function of time The most common periodic graphs are the graphs of the trigonometric functions Sine, cosine, tangent, cosecant, secant, and cotangent
The Sine Graph 2 2 2 2 3 3 2 2 0 Oscillation-one complete cycle of the graph Period- time (horizontal distance) it takes the graph to complete one oscillation Amplitude-the furthest vertical distance the graph ventures from the vertical center
The Sine Graph 2 2 2 2 3 3 2 2 0 We think of the sine graph as starting at an x-value of zero It begins at a y-value of zero It then moves up the distance of its amplitude Next it moves back down to the x-axis Then it moves down the distance of its amplitude The it completes an oscillation by moving back up the x-axis
The Sine Graph 2 2 2 2 3 3 2 2 0 The period of the sine graph is So the horizontal length of each piece of the sine graph is The amplitude of the sine graph is (think about the values of sine)
The Cosine Graph The cosine graph is the same as the sine graph, only it has been shifted horizontally Same period Same amplitude
The Cosine Graph 2 2 2 2 3 3 2 2 0 Same period Same amplitude The starting point is still an x-value of zero, but is now a y-value of 1
Sine and Cosine Graphs While the idea of a starting point is very helpful when graphing, it is merely an idea These graphs have infinite domains We have thus far only looked at library versions. There will be transformations.