Sleep Data Analysis for Cardiovascular Disease Risk Factors
Explore the associations between sleep disturbances and cardiovascular disease risk factors by analyzing data from polysomnography, actigraphy, and sleep questionnaires in a large cohort. Investigate disparities by ethnicity, gender, and socioeconomic status to understand their impact on CVD disparities.

Download Presentation

Please find below an Image/Link to download the presentation.
The content on the website is provided AS IS for your information and personal use only. It may not be sold, licensed, or shared on other websites without obtaining consent from the author. If you encounter any issues during the download, it is possible that the publisher has removed the file from their server.
You are allowed to download the files provided on this website for personal or commercial use, subject to the condition that they are used lawfully. All files are the property of their respective owners.
The content on the website is provided AS IS for your information and personal use only. It may not be sold, licensed, or shared on other websites without obtaining consent from the author.
E N D
Presentation Transcript
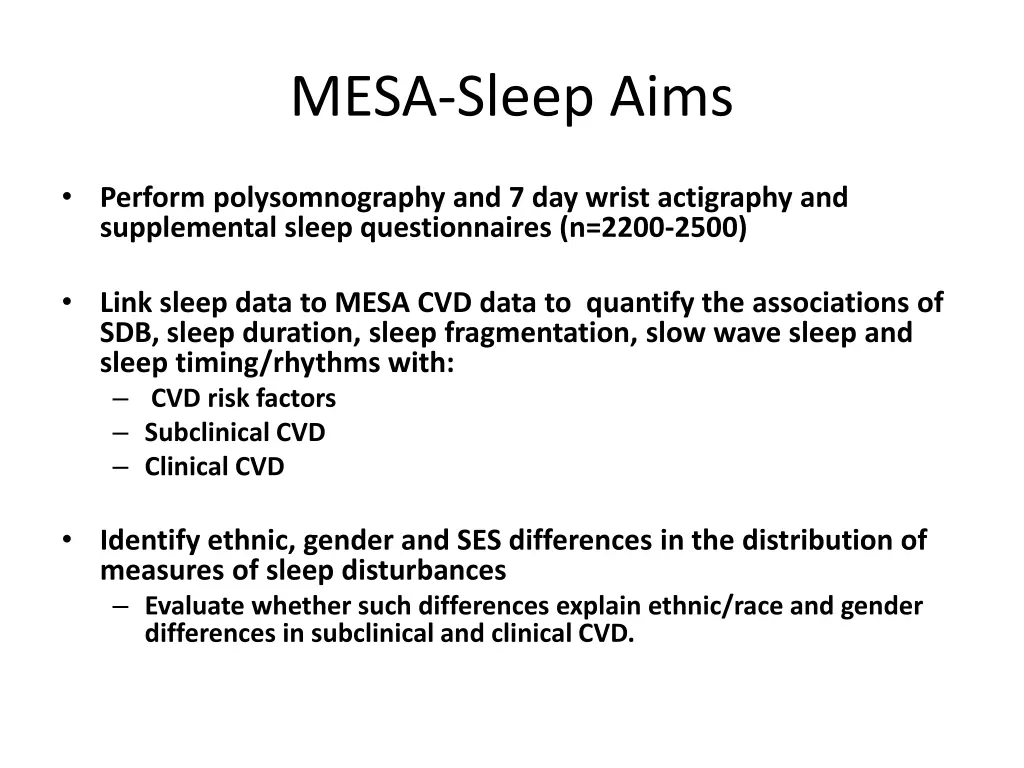
MESA-Sleep Aims Perform polysomnography and 7 day wrist actigraphy and supplemental sleep questionnaires (n=2200-2500) Link sleep data to MESA CVD data to quantify the associations of SDB, sleep duration, sleep fragmentation, slow wave sleep and sleep timing/rhythms with: CVD risk factors Subclinical CVD Clinical CVD Identify ethnic, gender and SES differences in the distribution of measures of sleep disturbances Evaluate whether such differences explain ethnic/race and gender differences in subclinical and clinical CVD.
Sleep Reading Center Activities 21 certified field staff (17 active) 3 certified scorers Regular reliability; AHI ICC >.97 Problem with PLMs-corrected Quality reports-reviewed monthly More intense trouble shooting as needed/re-training for new staff Weekly transmission to CC; monthly calls
Sleep Data Received 1297 PSGs and actigraph studies received PSGs: 77% PSGs very good or better 4.8% failure Actigraphs Mean days with good data: 7 +/- .5 days 3% failure Site equipment, battery, supply updates
PSG Study Quality by Site Very Good Excellent Site Total N % Fail 3-WakeForest 195 5.1% 78.5% 4-Columbia 239 4.2% 67.8% 5-Johns Hopkins 228 2.6% 80.3% 6-Minneapolis 230 2.6% 77.4% 7-Northwestern 194 3.1% 80.9% 8-UCLA 158 13.9% 75.9% Totals 1244 4.8% 76.6%
PSG Failure Causes 50 45 40 35 30 25 20 15 10 5 0 Oximetry EEG Short Multiple Other
Change in Sleep Quality (% >Very Good) Q1 2011 to 2012 100 90 80 70 60 Q1 11 50 Q1-2 12 40 30 20 10 0 WFU COL JHU UMN NU UCLA
PSG Findings and SDB In MESA 1.8% Urgent Referral (A Fib, NSVT, low oxygen) 1.8% Cheyne Stoke Respiration 43% with moderate-severe SDB (AHI>15) 10x rate of doctor diagnosed SDB in MESA 35 30 25 20 15 10 5 0 <5 5 to 15 15 to 30 >30 AHI Level
Analyses and Extensions Minority supplement funded Dennis Dean HTN analyses Arterial stiffness derived from the oximetry pleth waveform (with D Jacobs) Pollution, weather and sleep Sleep Informatics and Data Sharing Resource (R24 pending) Genetics project-rare variants (pending)
Paper Proposal Possibilities Linking sleep to: Indices of RV/Pulm HTN COPD-OSA HTN, LVM, cardiac function Stress, socioeconomic, environment HF, CSB, BNP outcomes Qol Inflammatory, metabolic and cardiac biomarkers Inter-relationship with health behaviors Genetics Etc etc etc
Plans: Initiate monthly sleep scientific calls (N Punjubi (JHU), P Lutsy (UMN), P Zee (NU)) Nominate your representative(s)


")