Social and Economic Analysis of Welfare and Market: A Comparative Study
This study delves into the social, economic, and legal aspects of welfare and market dynamics through a comparative analysis conducted by a group of researchers from different institutes. The research explores issues of generalized dissatisfaction, inequality trends, polarization, and conflict in the MENA region. It also discusses the impact of relative and absolute inequality on household incomes, shedding light on the complexities of inequality dynamics. Through various data sources, the study provides insights into the evolving landscape of social welfare and market structures in the Arab world before and after significant events like the Arab Spring.
Download Presentation

Please find below an Image/Link to download the presentation.
The content on the website is provided AS IS for your information and personal use only. It may not be sold, licensed, or shared on other websites without obtaining consent from the author.If you encounter any issues during the download, it is possible that the publisher has removed the file from their server.
You are allowed to download the files provided on this website for personal or commercial use, subject to the condition that they are used lawfully. All files are the property of their respective owners.
The content on the website is provided AS IS for your information and personal use only. It may not be sold, licensed, or shared on other websites without obtaining consent from the author.
E N D
Presentation Transcript
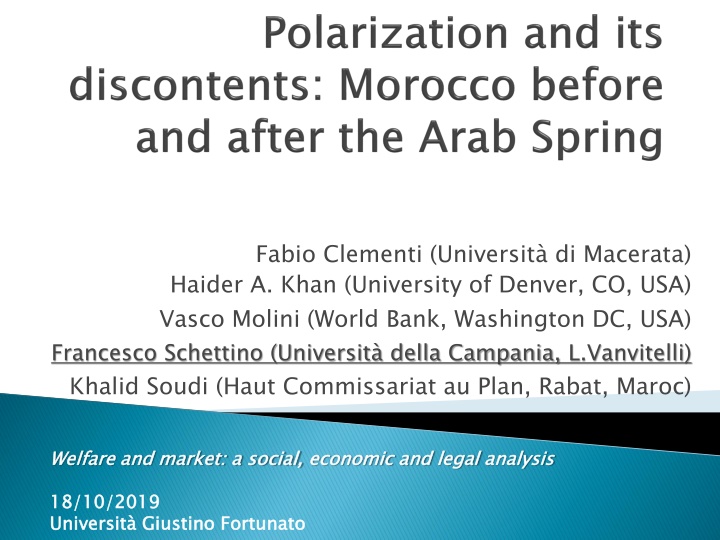
Fabio Clementi (Universit di Macerata) Haider A. Khan (University of Denver, CO, USA) Vasco Molini (World Bank, Washington DC, USA) Francesco Schettino (Universit della Campania, L.Vanvitelli) Khalid Soudi (Haut Commissariat au Plan, Rabat, Maroc) Welfare and market: a social, Welfare and market: a social, economic economic and and legal legal analysis analysis 18 Universit Giustino Fortunato 18/ /10 Universit Giustino Fortunato 10/ /2019 2019
The Arab World before and after the Arab Spring Absolute vs Relative Morocco: 2001-2013 Absolute measures and perception in Morocco: 2001- 2013
Relative Gini Indexes in the MENA Region: 2001-2016 43 41 39 37 35 33 31 29 27 25 Egypt Morocco Tunisia Jordan WestBank/Gaza Iraq Source: Povcalnet, World Bank
1. There seems to be no correlation between this generalized dissatisfaction and inequality (Devarajan and Ianchovichina, 2017). 2. Inequality has been stagnant or declining since the end of 90 s (Belhaji 2012, Verme, 2016) although some works (Alvaredo et al., 2018) question the veracity of the figures arguing that they are underestimated. 3. Polarization, often identified as one of the root causes of social instability and conflicts (Esteban and Ray 2015) is moderate and stable throughout the period. 4. Recent evidence suggests that polarization translates into open conflict in MENA region only in presence of non non only in presence of non- -humanitarian, neutral intervention (Abu Badr, Ianchovichina a, 2018) humanitarian, non- -neutral intervention
Consider an economy with just two household incomes: $1,000 and $10,000. If both incomes double in size then relative inequality will remain the same; the richer household is still 10 times richer. But the absolute difference in their incomes has doubled, from $9,000 to $18,000. Relative inequality is unchanged but absolute inequality has risen (Martin Ravallion, 2003).
1. The subjective perception of a rising inequality appears often to be referring to the absolute concept of inequality (Ravallion, 2003). 2. In experiments used to identify which concept of inequality is held by people, it was found that 40% of participants thought about inequality in absolute terms (Ravallion, 2003). 3. It is arguably absolute inequality that most people see in the daily lives and that motivates their concerns about distributive justice when they talk about the gap between the rich and the poor and the widening economic divide (Amiel and Cowell, 1999) .
Source: Authors elaboration based on ENCDV 2001, 2013
100 80 60 percent 40 20 0 2006 2013 2006 2013 2006 2013 2006 2013 2006 2013 Q1 Q2 Q3 Q4 Q5 Very Rich Very Poor Rel Rich N/A Middle Rel Poor Source: Author s elaboration based on ENCDV 2001, 2013
Transports Schooling Source: Author s elaboration based on ENCDV 2001, 2013 2/15/2025
Are results from absolute measures more correlated to the welfare perception? 17
Absolute Indexes of Inequality and Polarization 1600 1400 1200 1000 800 600 400 200 0 Gini abs FW abs 2000 2006 2013 Source: Author s elaboration based on ENCDV 2001, 2013
Absolute measures: the relative distribution (1) The relative distribution method (Morris et al., 1994; Handcock and Morris, 1998, 1999) is a non-parametric approach that compares the distribution of two populations, considering differences over the entire range of the distribution. Let Y0be the income variable for the reference population and Y the income variable for the comparison population. The relative distribution is defined as the ratio of the density of the comparison population to the density of the reference population evaluated at the relative data r: ?(?? 1? ) ?0(?0 1? )= ?(??) ?0(??) ? ? = 0 ? 1; ?? 1, where f( ) and f0( ) denote the density functions of Y and Y0, respectively, and yr= ?0 1(?) is the quantile function of Y0.
Absolute measures: the relative distribution (2) This method offers the possibility to decompose the relative distribution into changes in location and changes in shape: the location component can be attributed to a change in the distribution s mean or median, while the shape component includes differences in variance, asymmetry and/or other distributional characteristics. ?(??) ?0(??)=?0?(??) ?(??) ???(??) ??(??) x ?0?is a counter-factual distribution with the same shape as the reference distribution but with the median of the comparison distribution. The relative distribution approach includes a median relative polarization index, which is a measure showing how the comparison distribution is more polarized than the reference one: ? ??? =4 ?? 1 ?( ?=1 2) 1 The MRP index can be decomposed into the contributions from the lower and upper tails of the distribution (Handcock and Morris, 1999).
Kernel densities: 2001- 2013 Overall 22
Location effect Shape effect 23
Testing the association between consumption polarization and household self-reported welfare (1) Multinomial logit (MNL) model based on 2013 data: 5 9 Pr ??= ? Pr ??= 2 ln = ??+ ?? ???? ????? + ??????, ? = 1,2, ,?, ? = 1,3,4. =1 ?=1 The ? = 4 categories are possible answering options (1 = Improved; 2 = Not changed; 3 = Worsened; 4 = Do not know) to the question: If we compare the current living standards of your family with those ten years ago (in about 2003), do you think ? ; the response option Not changed is the reference category. The ? s are household-level controls including household size, gender, age, marital status, literacy, education, employment status and location (rural/urban and region). The variable ????? is an indicator variable identifying which economic class households belong to among the following five different groups: 1 = Poor; 2 = Vulnerable; 3 = Lower-middle class; 4 = Middle class; 5 = Upper-middle class; this variable is interacted with ??? to investigate how the impact of the latter on households welfare perceptions varies across classes with different economic status. 27
Testing the association between consumption polarization and household self-reported welfare (2) The polarization variable: ????= 4|?? 1 2| 1, ? = 1,2,...,?, ranges between -1 and 1 and measures how far the relative ranks of the 2013 consumption values in the median-adjusted consumption distribution of 2000 deviate (in absolute value) from comparison and the location-adjusted reference distributions. Negative values would mean that households in the lower (upper) quantiles of the comparison population tend to concentrate at the median of the reference, a very strong sense in which they are better-off (worse-off) than households in the corresponding reference population. On the other hand, positive values would correspond to a situation where households in the lower (upper) quantiles of the comparison population tend to concentrate near the bottom (top) of the reference, meaning they are worse-off (better-off) than households in the corresponding reference population. On average: 12, i.e. the median value of the relative distribution between the 1 ? ?=1 ? ????= ???. 28
Testing the association between consumption polarization and household self-reported welfare (3) Interpretation in terms of relative risk rates (???s): ??? > 1 indicates that the probability of selecting, say, the response option Improved compared to that of responding Not changed increases as the variable ??? (and hence polarization) increases the comparison outcome is more likely. ??? < 1 indicates that the probability of selecting the response option Improved compared to that of responding Not changed decreases with polarization the reference outcome is more likely. o o (a) By classes (b) By quintiles MRP # Poor MRP # Q1 MRP # Vulnerable MRP # Q2 Improved Improved MRP # Lower-middle class MRP # Q3 MRP # Middle class MRP # Q4 MRP # Upper-middle class MRP # Q5 MRP # Poor MRP # Q1 MRP # Vulnerable MRP # Q2 Worsened Worsened MRP # Lower-middle class MRP # Q3 MRP # Middle class MRP # Q4 MRP # Upper-middle class MRP # Q5 0 1 2 3 4 5 0 1 2 3 4 Relative risk rate Relative risk rate 29
Testing the association between consumption polarization and household self-reported welfare (4) The results for Improved relative to Not changed reveal particularly insightful into the relation between consumption polarization and household self-reported welfare: o Keeping all the other variables constant, if polarization were to increase, the relative probability of declaring that a household s welfare improved, rather than not changed, is 1 0.431 100 = 56.9% lower for the poor, 1 0.574 100 = 42.6% lower for the vulnerable, and households in the lower-middle class albeit this decrease in relative probability is not significant. o For middle-class and upper-middle-class households, instead, the same relative probabilities are, respectively, 3.217 1 100 = 221.7% and 100 = 242.5% higher. Similar results hold vis- -vis a robustness check where the MNL model was re-estimated by replacing the factor variable ????? with a new indicator variable ??? identifying quintiles of expenditure. Overall, the econometric findings consistently converge towards a story of downgrading self-perceived economic status that is significantly explained by the increasing polarization that has affected the Morocco s distribution of welfare between 2000 and 2013. 1 0.872 100 = 12.8% lower for 3.425 1 30
