Societal Poverty Measure: Building Blocks and Relative Lines
This content delves into the concept of societal poverty, introducing a new global measure incorporating fixed and relative elements. It discusses the Atkinson Commission's proposal on global consumption poverty and explores various relative poverty lines and their implications. The presentation highlights the need for harmonized national poverty lines informed by social assessments of basic needs and addresses statistical considerations in poverty estimation.

Uploaded on Feb 28, 2025 | 0 Views
Download Presentation

Please find below an Image/Link to download the presentation.
The content on the website is provided AS IS for your information and personal use only. It may not be sold, licensed, or shared on other websites without obtaining consent from the author.If you encounter any issues during the download, it is possible that the publisher has removed the file from their server.
You are allowed to download the files provided on this website for personal or commercial use, subject to the condition that they are used lawfully. All files are the property of their respective owners.
The content on the website is provided AS IS for your information and personal use only. It may not be sold, licensed, or shared on other websites without obtaining consent from the author.
E N D
Presentation Transcript
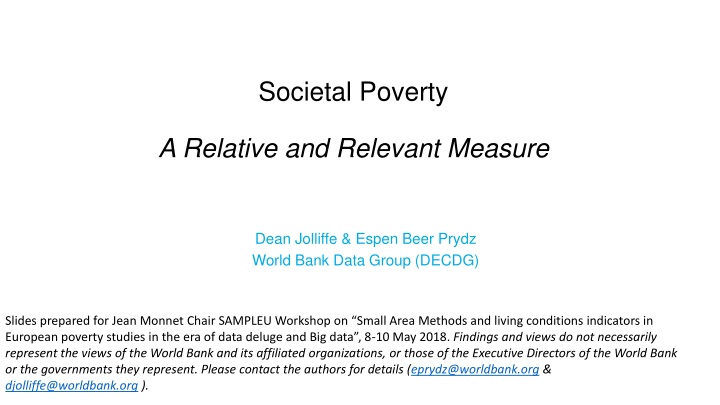
Societal Poverty A Relative and Relevant Measure Dean Jolliffe & Espen Beer Prydz World Bank Data Group (DECDG) Slides prepared for Jean Monnet Chair SAMPLEU Workshop on Small Area Methods and living conditions indicators in European poverty studies in the era of data deluge and Big data , 8-10 May 2018. Findings and views do not necessarily represent the views of the World Bank and its affiliated organizations, or those of the Executive Directors of the World Bank or the governments they represent. Please contact the authors for details (eprydz@worldbank.org & djolliffe@worldbank.org ).
I. Atkinson Commission on Global Poverty introduce a societal headcount measure of global consumption poverty, combining fixed and relative elements II. Motivation i. Theoretical motivations for why poverty lines may be increasing in consumption Sen (1983) a concept of poverty fixed in terms of functionings may not be fixed in terms of expenditures (consider labor market participation, requires clothing in a poor country but quite a bit more in rich countries) ii. Empirical regularity that national lines are increasing in wealth of the country Ravallion, range of basic needs: $0.63 to $9 III. This presentation i. Building Blocks A new set of harmonized national poverty lines ii. Societal Poverty A proposed parameterization for a global relative poverty line
Relative poverty lines Strongly Relative Poverty Line (SRPL) (OECD, EU, Garroway & de Laiglesia, 2012) Relative Poverty Line Atkinson & Bourguignon (2001) Societal Poverty Line (this paper) Weakly Relative Poverty Line Ravallion & Chen (2011) poverty line (Z) poverty line (Z) poverty line (Z) poverty line (Z) slope=k slope=k slope=k slope=k Z* Z* Z* Z* >0 >0 >0 >0 =0 =0 =0 =0 M* M* M* M* mean/median (M) mean/median (M) mean/median (M) mean/median (M) (intercept=1.00, slope = 0.50, Z*=1.90) 2011 PPPs (intercept=0, slope = 0.37, Z*=1.25) (intercept=0.60, slope = 0.33, Z*=1.25)
Building Blocks Building Blocks A new set of harmonized national poverty lines A new set of harmonized national poverty lines Existing specifications of the relative poverty lines are founded on data sets of national poverty lines. Principle: global measures informed by social assessments of basic needs. AB based on 33 national poverty lines, RC based on twice as many. The $1.25 and $1.90 IPL are based on 15 estimated national poverty lines from Ravallion, Chen, Sangruala (RCS15, 2009). RCS database of 74 poverty lines has been critical input for poverty estimation, but in need of an update Age: On average, RCS15 require 14 years of inflation data to bring to 2011. CPI data quality correlated with income status; RCS15 are very poor countries (3 countries CPI not used) Statistical support: The 15 countries represent about 13% of the estimated poor in 2011. Deaton s criticism: small shifts in the composition of these countries, large changes in poverty Mixed units, 5 of the RCS15 are expressed in adult-equivalent units, 10 in per capita: Per capita lines correspond with wellbeing measure in Povcal net, Reflect needs of average person (adolescent ). Per-capita lines typically about 0.7 * value of adult lines Some countries only report regional, not national poverty lines. 4
Building Blocks Building Blocks A new set of harmonized national poverty lines A new set of harmonized national poverty lines Instead of collecting national poverty lines from poverty assessments, use Poverty headcounts (h) from WDI, Consumption cumulative distribution function (F) extracted from PovcalNet. Identify the unique value z such that h=F(z). => 699 national poverty lines harmonized in per capita terms from 107 countries This approach ensures: All poverty lines (z) are expressed in per capita terms by definition of wellbeing. All poverty lines (z) correspond to the national headcount by construction. 9-fold increase in statistical support over RCS, covering both old and new lines Our 2011 subsample of national poverty lines (lines from 104 countries, close to 2011), need on average 1 year of inflation data to bring to the 2011 benchmark (contrast 14 yrs.) We use this database for estimation of income-class and societal poverty lines Jolliffe, D., Prydz, E. B. 2016. Estimating International Poverty Lines from Comparable National Thresholds, Journal of Economic Inequality, 14(2): 185-98. 5
Why not use national poverty lines for societal poverty? Why not use national poverty lines for societal poverty? Plot national poverty lines on average national wellbeing (median, avg, HFCE). Upward sloping, definition of basic needs varies widely across nations If global measure is to be informed by national assessments, why not determined ? National lines will continue to be the focus of country dialogue, SPL not a replacement As a global poverty measure, 2x differences in estimated needs across range. Societal Poverty Line is a yardstick for counting up across countries. The relative attribute means that it varies by income group, but we argue it is undesirable to allow the measure to vary twofold for countries of the same income National Poverty Lines and Economic Development 20 10 5 poverty line 2 1 log scales 1 2 5 10 20 40 median cons/inc Full sample 2011 Sample q10/q90
Comparing data sets of national poverty lines 20 20 10 10 poverty line (lowess) poverty line 5 5 RCS flattens at tail 2 We observe no flattening of the gradient 2 1 1 1 2 5 10 20 40 1 2 5 10 20 40 mean consumption (HFCE) mean consumption (HFCE) JP - all JP - 2011 RCS JP - all JP - 2011 RCS
Societal Poverty Societal Poverty Fitting national lines on mean and median consumption (income) preferred model => $1 + 50% of median Our preferred model Chen & Ravallion model on our data (1) (2) (3) (4) (5) (6) z z z z z z 0.50*** 0.53*** 0.49*** Survey median 0.55*** (20.13) (51.32) (4.57) (9.81) 0.40*** 0.42*** Survey mean -0.04 0.03 (11.90) (33.75) (-0.41) (0.78) 1.01*** 0.98*** 0.73** 0.70*** 0.95*** Constant 1.05*** (6.81) (15.88) (3.16) (8.39) (7.01) (12.89) R-squared 0.86 0.86 0.81 0.82 0.86 0.86 N 104 699 104 699 104 699 Sample 2011 lines All lines 2011 lines All lines 2011 lines All lines
Societal Poverty: Assessing fit Deviation between national & societal poverty rates Latest observation All observations Comparing Comparing National poverty rates and various measures of societal poverty Mean absolute deviation Mean absolute deviation Mean deviation Mean deviation Relative global line $1 + 50% median & max($1.90, $1+50% median) both correspond well with national assessments of poverty SPL ($1 + 50% of median) 8.7 1.7 9.5 -1.9 SPL w lower bound at $1.90 9.1 2.3 9.7 -1.3 Chen and Ravallion (WRPL) Strongly relative (50% of median) 14.0 12.4 12.5 9.5 19.5 -18.1 18.5 -17.4
Societal Poverty Line, comparing with national lines relevance 20 Comparing Comparing National poverty lines (blue), $1+50% median (red), 50% (green) 10 5 poverty line Strongly relative line, too Strongly relative line, too low for poor countries low for poor countries 1.9 $1 + 50% median fits rich $1 + 50% median fits rich and poor and poor 1 1 1.9 5 10 20 40 median cons/inc Relative (1+.5 median) 50% of median
Societal Poverty Rates, comparing with national rates relevance RC: Weakly relative 100 80 Poverty rate at RC-WRPL 60 40 100 100 20 0 80 80 Poverty rate at SPL w/lower bound 0 20 40 60 80 100 Poverty rate at NPL Poverty rate at SPL 60 60 50% median 100 40 40 80 20 20 Poverty rate at SRPL 60 0 40 0 0 20 40 60 80 100 0 20 40 60 80 100 Poverty rate at NPL Poverty rate at NPL 20 0 Societal Poverty with and without the $1.90 lower bound 0 20 40 60 80 100 Poverty rate at NPL
Elasticity of Societal Poverty Line 1 Elasticity w.r.t median income / Share .8 .6 .4 .2 0 1 2 4 Median income/consumption 8 16 32 64 SPL, elasticity SPL w/LB, elasticity Fixed share of SPL
Societal Poverty Societal Poverty Interpreting $1 + 50% of median Relativist gradient of 50% of median is used in many high income countries. OECD s headline poverty indicator based on half the median household income . Eurostat at-risk-of poverty thresholds : 40%, 50%, 60% of national median (& mean) income. NSOs in rich countries frequently also report using similar lines (50% or 60% of median). The intercept ( ) is the fixed element, $1 has some basis in existing literature $1/day = global consumption floor in 2011 PPPs proposed by Ravallion (2016). Allen (2016) & Lindgren (2015) estimate of bare-bones basket is similar. Empirically we observe no floor, Z*, but treating $1 as the fixed element representing absolute basic needs may be unpalatable (e.g. Allen), even in the limit. Poverty lines are social assessments. An alternative floor to $1 is the existing $1.90 IPL, suggesting an alternative parameterization Max ($1.90 , $1 + 50% of median) binding for about 3% of global population in 2013
Societal Poverty Comparing trends: extreme poverty, societal poverty, max(1.9, 1+ 50% median) Number of poor Poverty rate 50 2500 Poverty headcount ratio (% in poverty) 40 2000 Number of poor (million) 30 1500 1000 20 500 10 1980 1985 1990 1995 2000 2005 2010 2015 1980 1985 1990 1995 2000 2005 2010 2015 Year Year SPL SPL w/lower bound IPL ($1.90) SPL SPL w/lower bound IPL ($1.90)
Mean value of the societal poverty line 8 7 Mean poverty line (pop. weighted) 6 5 4 3 2 1 0 1980 1985 1990 1995 2000 2005 2010 2015 Year SPL - All countries SPL - w/o HICs SPL w/LB - All countries SPL w/LB - w/o HICs
Societal Poverty, by income classification Change (p.p.) 1981-2013 Income group 1981 1990 1999 2008 2013 Low income 61.6 62.3 63 55.5 50.7 -10.9 Lower middle income 51.5 46.9 45 39.7 34.3 -17.3 Upper middle income 56.4 48.2 40.7 30.8 25.5 -30.9 High income 15.5 15.5 15.4 15.6 15.8 0.3
Societal Poverty, by regions Change (p.p.) 1981-2013 Region(s) 1981 1990 1999 2008 2013 East Asia & Pacific 67 55.1 43.9 33 26.4 -40.6 Europe & Central Asia 15.2 16.3 20.1 16.2 15.9 0.7 Latin America & Caribbean 34.9 34.8 34 29.9 28.1 -6.8 Middle East & North Africa 30.7 28.4 26.7 24 22.2 -8.5 North America 19.1 19.6 18.6 19.5 19.5 0.4 South Asia 54.4 49.2 46.6 41.7 34.7 -19.7 Sub-Saharan Africa 52.5 55 57 51.1 47.8 -4.8 World -Excluding 'Other High Income Countries'* 46.5 42.3 39.2 33.4 29.3 -17.2 53.6 47.8 43.8 36.7 31.7 -21.9
A few concluding comments We propose a measure of Societal Poverty Our proposed societal poverty line has an intercept of $1 and slope of 50% of median consumption or income level of the country. One proposed alternative includes a lower bound of $1.90 MAX($1.90, $1 + 50% * median consumption) Weakly relative line Relevant in that it corresponds strongly with national assessments of poverty
Thank you Papers available at: Jolliffe, D. and E.B. Prydz. Societal Poverty: A Relative and Relevant Measure, World Bank Policy Research Working Paper series no. 8073, 2017. http://documents.worldbank.org/curated/en/133671495562984832/Societal-poverty-a-relative-and- relevant-measure Jolliffe, D. and E.B. Prydz. Estimating International Poverty Lines from Comparable National Thresholds, Journal of Economic Inequality, 2016, 14(2): 185-98. (also PRWPS7606). doi: 10.1007/s10888-016-9327-5 http://documents.worldbank.org/curated/en/2016/03/26083870/estimating-international-poverty-lines-comparable- national-thresholds
Global relative poverty lines, Proposals Relative lines Atkinson & Bourguignon Relative Poverty Line (AB-RPL) Atkinson and Bourguignon (2001) Ravallion & Chen Weakly Relative Poverty Line (RC-WRPL) Strongly Relative Poverty Line (SRPL) Societal Poverty Line (SPL) Name of proposal Ravallion and Chen (2011) Chen and Ravallion (2013) EU, OECD, Garroway and de Laiglesia (2011) Reference(s) (this paper) Number of national lines (countries) used in parameterization PPPs Economic variable (M) 33 (33) 74 (74) 74 (74) n/a 699 (107) 1985 PCE from National Accounts 2005 PCE from National Account 2005 Mean consumption from household survey n/a Mean consumption from household survey 2011 Median consumption from household survey Parameters Gradient (k) Intercept ( ) Lower bound (Z*) 0.37 0 $1 (IPL) 1/3 $0.60 $1.25 (IPL) 1/2 $0.625 $1.25 (IPL) 1/2 0 0 1/2 $1 SPL variant, $1.90 (IPL) SPL variant $1.80 Kink M* = (Z*- )/k) $2.70 $1.95 $1.25 n/a
Atkinson: Societal Poverty Measure Atkinson: Societal Poverty Measure Log Log- -Log Log: Fitting national lines on mean and median consumption (income) preferred model => $1 + 50% of median Our preferred model Chen & Ravallion model on our data (1) (2) (3) (4) (5) (6) z z z z z z 0.69*** 0.72*** 0.60*** 0.45** Survey median (0.03) (0.03) (0.20) (0.18) 0.72*** 0.74*** 0.10 0.28 Survey mean (0.03) (0.03) (0.21) (0.20) 0.18*** 0.16*** -0.10* -0.13** 0.14 0.04 Constant (0.04) (0.05) (0.06) (0.07) (0.10) (0.11) 0.835 0.805 0.814 0.797 0.836 0.810 R-squared 104 699 104 699 104 699 N Sample 2011 lines All lines 2011 lines All lines 2011 lines All lines
Societal Poverty Lines, by income classification Change Income group 1981 1990 1999 2008 2013 1981-2013 Low income 1.8 1.7 1.8 1.9 2 0.3 Lower middle income 2.1 2.2 2.2 2.5 2.8 0.7 Upper middle income 2.9 2.8 3 4.4 5.5 2.6 High income 13.7 16.9 18.7 21.2 21 7.3
Societal Poverty Lines, by regions Change Region(s) 1981 1990 1999 2008 2013 1981-2013 East Asia & Pacific 2.5 3.1 3.5 4.5 5.6 3.1 Europe & Central Asia 9.5 10.3 11.2 14 14.3 4.7 Latin America & Caribbean 4 3.8 4 5.2 6 1.9 Middle East & North Africa 3.4 3.8 4 4.7 5 1.6 North America 18.9 22.7 23.8 25.6 25.1 6.2 South Asia 1.9 2 2.1 2.2 2.5 0.7 Sub-Saharan Africa 2.1 2 1.9 2.1 2.2 0.1 World 4.8 5.2 5.4 6.3 6.7 1.9 -Excluding 'Other High Income Countries' 2.6 2.6 2.7 3.4 4 1.4
Comparing Relative Poverty and National Comparing Relative Poverty and National Poverty Headcount rates Poverty Headcount rates 100 100 80 80 Poverty rate at SPL w/lower bound Poverty rate at SPL 60 60 40 40 20 20 0 0 0 20 40 60 80 100 0 20 40 60 80 100 Poverty rate at NPL Poverty rate at NPL
I. Details of the $1.25 international poverty line (IPL) Ravallion, Chen & Sangraula (WBER, 2009) Update the IPL to per capita $1.25-a-day using 2005 PPPs for consumption. Compilation of national poverty lines from the Bank s country-level Poverty Assessments for 74 countries Poverty lines viewed as social assessments of the cost of basic needs in each country, Basic needs are upward sloping in average wellbeing. Reference group of the poorest 15 countries. Malawi, Mali, Ethiopia, Sierra Leone, Niger, Uganda, Gambia, Rwanda, Guinea-Bissau, Tanzania, Tajikistan, Mozambique, Chad, Nepal and Ghana. Figure 1: National poverty lines for 74 developing countries plotted against mean consumption using consumption PPPs for 2005 300 National poverty line ($/month at 2005 PPP) 200 100 0 3 4 5 6 7 Log consumption per person at 2005 PPP Note: Fitted values use a lowess smoother with bandwidth=0.8 Levels on logs
Societal Poverty Measure Societal Poverty Measure Atkinson Commission recommendation 20: introduce a societal headcount measure of global consumption poverty, combining fixed and relative elements Global relative line existing proposals Observing income gradient in poverty lines (Ravallion, range of basic needs: $0.63 to $9) Atkinson & Bourguignon, relative line (intercept=0, slope = 0.37, Z*=1.25) Chen & Ravallion s weakly relative line (intercept =0.6, slope =0.33, Z*=1.25) We build on CR & AB Use our dataset of harmonized lines 26 Jolliffe, D., Prydz, E. B. 2017. Societal Poverty: A Relative and Relevant Measure, mimeo.


")