Socio-Economic Diversity in UK Financial Services
Explore the findings of a baseline survey on socio-economic diversity in UK financial and professional services conducted by the Socio-Economic Diversity Taskforce. The report highlights the underrepresentation of individuals from lower socio-economic backgrounds in senior roles and sheds light on the challenges they face in career progression.

Download Presentation

Please find below an Image/Link to download the presentation.
The content on the website is provided AS IS for your information and personal use only. It may not be sold, licensed, or shared on other websites without obtaining consent from the author. If you encounter any issues during the download, it is possible that the publisher has removed the file from their server.
You are allowed to download the files provided on this website for personal or commercial use, subject to the condition that they are used lawfully. All files are the property of their respective owners.
The content on the website is provided AS IS for your information and personal use only. It may not be sold, licensed, or shared on other websites without obtaining consent from the author.
E N D
Presentation Transcript
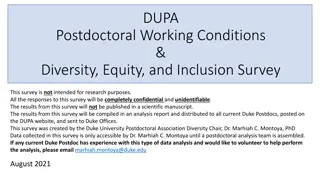
Socio-Economic Diversity in UK Financial and Professional Services Baseline Survey Report for IFoA
Overview & contents The Socio-Economic Diversity Taskforce conducted a survey to establish a socio-economic background baseline for UK financial and professional services. The survey was in field October 2021 March 2022 and received 9,362 responses from 49 organisations. This deck summarises the key findings for IFoA and is based on 1242 responses. Please note, company data may not be statistically significant, so please interpret with caution*. Contents: Executive summary: Sector story Demographics: Socioeconomic background Demographics: Tenure & Seniority Demographics: Gender & Ethnicity Sentiment: Inclusion Sentiment: Progression Socio-economic background (SEB) is based on the occupation of the main household earner of respondent at age 14: Lower: technical and craft; routine or semi-routine manual and service occupations; long-term unemployed (working class) Intermediate: clerical/intermediate occupations; small business owners Higher: Senior, middle or junior managers or administrators; modern professional and traditional professional occupations (professional) *The margin of error with a confidence level of 95% (meaning there's a 95% chance that the sample correctly reflects the opinions of the overall population) is +/- 2.78% For more information on the calculation please visit the following available online margin of error calculator: https://www.surveyking.com/help/margin-of-error-calculator.
Executive summary: Sector story People from lower socio-economic backgrounds (SEB) remain underrepresented in UK financial and professional services, particularly at senior levels. Our survey suggests that 26% of all employees in the sector come from a working class, compared with 39% of the UK working population1;in other words, the representation of people from a working class is a third lower than we might expect. Moreover, people from a working class are not progressing at the same rate as their peers: just one-in-seven are working at a senior level2compared with one-in-five of peers from a professional. And this gap widens with age. Overall, 64% of senior positions are held by people from a professional. Employees from a working class are alert to the progression challenges they face in the workplace: 37% say their background has had a negative impact on their career (vs. just 14% who cite a positive impact). A quarter of employees from a working class (26%) do not believe they have the same chance of success in the workplace as their colleagues. As such, we find employees from a working class less satisfied with their career development on average. However, the clear divergence in advancement by SEB is not fully reflected in relative engagement levels. For example, the proportion of employees from a working class who feel included is similar to their peers from a professional (56% vs 63%); the same is true for those who feel their manager respects their contributions (76% vs 81%). This suggests that people from a working class may enter the workplace with lower expectations of how far and how fast they can progress. 1https://socialmobilityworks.org/wp-content/uploads/2021/05/Summary-report-on-measurement-changes_FINAL-Updated-May-2021.pdf
Demographics: Socio-economic background Employees (Overall) Employees (Senior Level) IFoA 20% 14% 66% IFoA 18% 14% 68% UK Financial Services 26% 16% UK Financial Services 58% 20% 15% 65% UK Financial & Professional Services UK Financial & Professional Services 26% 16% 58% 21% 15% 64% * Pending UK Average 39% 24% UK Average 37% 39% 24% 37% Working Class Intermediate Professional * Note: we determine socio-economic background based on occupation of main household earner at approx. aged 14. For more info see: https://socialmobilityworks.org/toolkit/measurement/ 4
Demographics: Gender, Ethnicity and Seniority Ethnicity UK Financial Services IFoA White Ethnic Minorities White Ethnic Minorities Professional 51% 57% 59% 69% Intermediate 24% 14% 21% 12% Working Class 26% 25% 22% 19% Gender Female Male Female Male Professional 56% 60% 64% 71% Intermediate 17% 15% 13% 16% Working Class 26% 26% 24% 14% Seniority Junior Mid-level Senior Junior Mid-level Senior Professional 57% 54% 65% 66% 66% 68% Intermediate 18% 16% 15% 13% 16% 14% Working Class 28% 27% 21% 20% 18% 18% 5
Demographics: Tenure Role tenure UK Financial Services IFoA Working Class Intermediate Professional Working Class Intermediate Professional 14% 15% 15% 15% 16% 18% 10+ years 19% 19% 20% 19% 24% 20% 5-9 years 23% 25% 23% 23% 20% 3-4 years 26% 21% 20% 20% 1-2 years 27% 27% 22% 23% 22% 22% Less than 1 year 16% 15% 14% 6
Demographics: School type Employees (Overall) UK Average IFoA Independent or fee-paying school 8% 19% 92% State-run school 81% Employees (Senior level) Independent or fee-paying school 23% 39% State-run school 77% 61% 7 * UK average for employees source: https://socialmobilityworks.org/toolkit/measurement/ UK average for employees (senior level) source: https://www.gov.uk/government/news/elitism-in-britain-2019
Sentiment: Inclusion I feel like a key component of my team with real influence over decisions (by SEB) I feel like I can bring my whole self to work (by SEB) Professional 6% 9% 36% 47% Professional 2% 1% 5% 21% 41% 32% UK Financial UK Financial Services Services Intermediate 0% 6% 10% 47% 37% Intermediate 6% 36% 28% 30% 1% Working Class 6% 13% 43% 35% Working Class 3% 10% 25% 38% 25% 2% Professional 6% 14% 49% 30% Professional 2% 8% 23% 47% 21% 2% IFoA IFoA Intermediate 17% 13% 44% 24% Intermediate 2% 9% 30% 44% 16% 1% Working Class 16% 13% 42% 25% Working Class 5% 11% 30% 35% 23% 2% Never Rarely Sometimes Most of the time Always Strongly disagree Disagree Neither agree nor disagree Agree Strongly agree 8
Sentiment: Progression What impact, if any, do you think your socio- economic background has had on your progression? % positive or very positive How satisfied are you with the pace of your career development to date? % satisfied or very satisfied In general, do you feel you have the same chance of success in the workplace as your colleagues? % yes, definitely or yes, to some extent 45% 65% 74% UK Financial Services UK Financial Services UK Financial Services 25% 60% 65% 13% 57% 60% 47% 70% 76% IFoA IFoA 21% 65% IFoA 67% 13% 65% 66% Professional Intermediate Working Class Professional Intermediate Working Class Professional Intermediate Working Class 9
Thank you For more information, please contact Olivia Larkin via Olivia.Larkin@cityoflondon.gov.uk