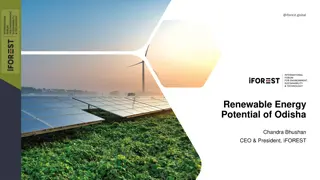
Implementation of renewable energies in Lebanon has been supported by initiatives like the NEEAP, focusing on energy efficiency and renewable energy adoption. The NREAP for 2016-2020 outlines trajectories, economic assessments, and socio-economic impacts, with NEEREA offering financing for EE and RE projects across Lebanon, benefiting various sectors.
Please find below an Image/Link to download the presentation.
The content on the website is provided AS IS for your information and personal use only. It may not be sold, licensed, or shared on other websites without obtaining consent from the author. If you encounter any issues during the download, it is possible that the publisher has removed the file from their server.
You are allowed to download the files provided on this website for personal or commercial use, subject to the condition that they are used lawfully. All files are the property of their respective owners.
The content on the website is provided AS IS for your information and personal use only. It may not be sold, licensed, or shared on other websites without obtaining consent from the author.
E N D
Presentation Transcript
SOCIO-ECONOMIC IMPACT OF THE IMPLEMENTATION OF RENEWABLE ENERGIES IN LEBANON BY JOSEPH AL ASSAD ADVISOR MINISTRY OF ENERGY AND WATER November 17, 2015 Financial Instruments For Distributed Solar Energy Technologies Crown Plaza Hotel, Lebanon
NEEAP 2011-2015 The first NEEAP for Lebanon was adopted by the Council of Ministers of Lebanon on 10 November 2011 (Decision No 26) It includes 14 initiatives that tackle energy efficiency and renewable energy
NEEAP INITIATIVES Legal and Awareness Renewable Energy Energy Efficiency Adoption of Energy Conservation Law and Institutionalization of the LCEC Promotion of PV and Wind Applications in the Residential and Commercial Sectors Banning the Import of Incandescent Lamps to Lebanon 3 1 2 4 Solar Water Heaters for Buildings and Institutions Design and implementation of a national strategy for efficient public street lighting 5 6 Building Code for Lebanon Electricity Generation from Wind Power 10 7 Electricity Generation from Solar Energy Financing Mechanisms and Incentives Paving the Way for Energy Audit and ESCO Business 13 11 8 Hydro Power for Electricity Generation Promotion of Energy Efficient Equipment 14 9 Awareness and Capacity Building 12 Geothermal, Waste to Energy, and Other Technologies
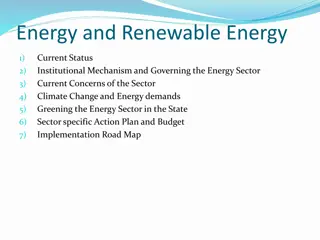
METHODOLOGY OF DEVELOPMENT OF NREAP International Outlook Potential Assessment Target Trajectories Target Scenarios Economic Assessment Socio-Economic Impacts
WHAT IS NEEREA? Financing EE and RE projects all over Lebanon. Lebanese commercial banks offering both technical and financial support. Subsidized interest rates: 0.6% Long repayment period: 14 years EU grant: 15%
ACHIEVEMENTS OF NEEREA More than 295 Million USD granted loans. 402 projects by the end of November 2015. 19 projects profited from the EU grant. More than 20 banks involved. 74 companies implementing. Reach out to several sectors (Residential, Industrial, Educational, ) 7/33
SCOPE Impact of the implementation of the NREAP on the job creation opportunities Selecting PV because of data availability IRENA reports 8/33
CREATING THE BENCHMARK 74 companies profiting from NEEREA 52 companies working on PV projects 30% 70% 9/33
NEEREA AND PV 226 projects Around 9.8 MWp 14.7 Million USD Around 15 GWh production 1.5 Million USD/MWp 0.98 USD/kWh (including backup in most cases) 10/33
STATISTICS Questionnaire covering year of establishment, administrative and technical jobs Out of the 74 companies, 52 replied, out of which 50 working on PV projects 11/33
IMPACT OF LCEC AND NEEREA ON THE MARKET 2014-2015, 6, 12% <2007, 10, 19% 2012-2013, 11, 21% 2008-2009, 8, 15% 2010-2011, 17, 33% 12/33
RESULTS 654 job opportunities created 67 opportunities per MW of installations 47 technical opportunities per MW 20 administrative opportunities per MW 14/33
PROJECTION Target for PV installations in NREAP for 2020 is 200-300 MW of installations Considering that technical opportunities will have a linear expansion for new installations 15/33
PROJECTION 8,930 to 13,630 technical opportunities to be created 285 to 435 Million USD market 16/33