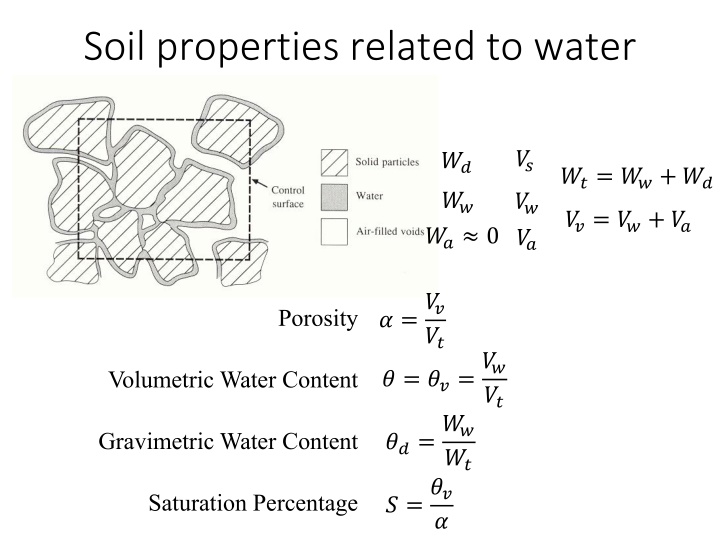
Soil properties related to water
Learn about the various soil properties related to water, including porosity, volumetric water content, gravimetric water content, and saturation percentage. Explore the concepts of macroscopic and microscopic features of a porous medium. Understand soil texture and its impact on water dynamics. Dive into examples and scenarios in hydrology to estimate drawdown and aquifer behavior due to pumping and infiltration. Visual aids and illustrations aid in grasping these essential concepts.

Uploaded on Feb 26, 2025 | 2 Views
Download Presentation

Please find below an Image/Link to download the presentation.
The content on the website is provided AS IS for your information and personal use only. It may not be sold, licensed, or shared on other websites without obtaining consent from the author.If you encounter any issues during the download, it is possible that the publisher has removed the file from their server.
You are allowed to download the files provided on this website for personal or commercial use, subject to the condition that they are used lawfully. All files are the property of their respective owners.
The content on the website is provided AS IS for your information and personal use only. It may not be sold, licensed, or shared on other websites without obtaining consent from the author.
E N D
Presentation Transcript
Soil properties related to water ?? ?? ??= ??+ ?? ?? ?? ?? ??= ??+ ?? ?? 0 ? =?? Porosity ?? ? = ??=?? Volumetric Water Content ?? ??=?? Gravimetric Water Content ?? ? =?? Saturation Percentage ?
Macroscopic and microscopic concepts of a porous medium. (from Freeze and Cherry, 1979)
0.002 mm 0.05 mm 2 mm 100 90 Gravel Clay Silt Sand Percentage finer by weight 80 70 60 50 40 30 20 10 0 0.001 0.01 0.1 1 10 100 Diameter (mm) Illustrative grain-size distribution curves. The boundaries between size classes designated as clay, silt, sand and gravel are shown as vertical lines.
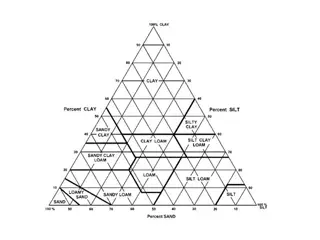
Soil Texture Triangle From Mays, 2011, Ground and Surface Water Hydrology
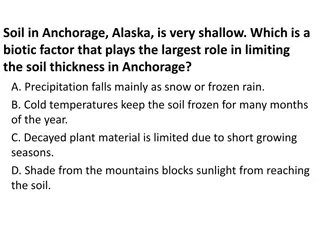
Example 2.5.1 Estimate the average drawdown over an area where 25 million m3 of water has been pumped through a number of uniformly distributed wells. The area is 150 km2 and the specific yield of the aquifer is 25%.
Estimate the average drawdown over an area where 25 million m3 of water has been pumped through a number of uniformly distributed wells. The area is 150 km2 and the specific yield of the aquifer is 25%. Now suppose that for this same aquifer there is 0.1 m of infiltration from rainfall. How much would the aquifer rise A. 0.1 m, B. 0.2 m, C. 0.3 D. 0.4 m, E. 0.5 m
Vertical Distribution of Subsurface Water From Mays, 2011, Ground and Surface Water Hydrology
Rise of water above water table due to capillary effects Water in capillaries is at negative pressure, i.e. under suction or tension From Mays, 2011, Ground and Surface Water Hydrology
Tensiometer for measuring water tension From Mays, 2011, Ground and Surface Water Hydrology
Negative Pressure Head. Suction vs Moisture content (from Freeze and Cherry, 1979)
Suction head -|| Moisture Content Illustration of capillary rise due to surface tension and relationship between pore size distribution and soil water retention curve.
Storage Coefficient for (a) confined and (b) unconfined aquifers From Mays, 2011, Ground and Surface Water Hydrology
Example 2.8.2 Determine the volume of water released by lowering the piezometric surface of a confined aquifer by 5 m over an area of 1 km2. The aquifer is 35 m thick and has a storage coefficient of 8.3 x 10⁻³. What is the specific storage of this aquifer If the aquifer was 50 m thick, what would the storage coefficient and volume of water released be?


 confined and (b) unconfined")