Solar Battery Investment Payback Calculation and Goals Overview
"Explore the process of solar battery investment payback calculation, equipment selection, and goal setting for a sustainable energy solution. Discover key insights on minimizing grid use, buying American-made products, and ensuring high-quality equipment installation and maintenance."

Download Presentation

Please find below an Image/Link to download the presentation.
The content on the website is provided AS IS for your information and personal use only. It may not be sold, licensed, or shared on other websites without obtaining consent from the author. If you encounter any issues during the download, it is possible that the publisher has removed the file from their server.
You are allowed to download the files provided on this website for personal or commercial use, subject to the condition that they are used lawfully. All files are the property of their respective owners.
The content on the website is provided AS IS for your information and personal use only. It may not be sold, licensed, or shared on other websites without obtaining consent from the author.
E N D
Presentation Transcript
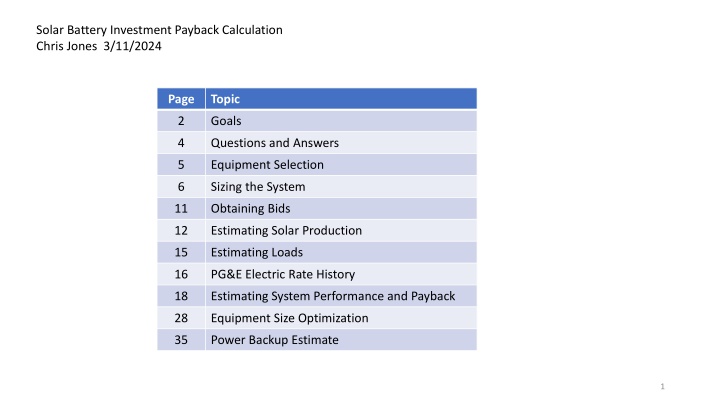
Solar Battery Investment Payback Calculation Chris Jones 3/11/2024 Page Topic 2 Goals 4 Questions and Answers 5 Equipment Selection 6 Sizing the System 11 Obtaining Bids 12 Estimating Solar Production 15 Estimating Loads 16 PG&E Electric Rate History 18 Estimating System Performance and Payback 28 Equipment Size Optimization 35 Power Backup Estimate 1
Goals 1. Minimize grid use, because the grid is not zero carbon and clean yet, and we must urgently make it so. 2. Buy American, to invest locally in jobs for products that are made to the high environmental standards and working conditions of the US. 3. Buy high quality long life equipment, so we invest our money wisely. 4. Buy equipment installed and maintained by local contractors with a good reputation that will take care of warranty repairs and ongoing maintenance cost and time effectively. 5. Purchase the right amount of equipment for the job. 6. Provide power backup during Public Safety Power Shutoffs during fire season and power outages during winter storms, although both are relatively rare for us in town. 2
Goals Goals I gave up on: I wanted to do it myself, like our original 2003 1.8 kW install with the help of my brother-in-law and a contractor that connected it to the circuit breaker. But I am very busy with work and life, and it would take me weeks including getting certified to obtain warranty support which is worth money, and I am fortunate to have some money to invest, so we decided to try to find a reputable local contractor to see if they could give a bid that competed with me DIYing it. The main components retail are inverter $7K, battery $11K and panels $4K so $22K + tax = $24K. The solar and battery portions of the bids were ~$37K so $13K for labor not counting additional parts. I think it would take me at least a few weeks to get certified with all the manufactures (if they would let me as an individual) and then do the install to get the warranty so 120 hours which is $108/hour which seems high but not out of the ball park, especially if there is a positive return on investment. I also wanted to make our own batteries from used EVs with my son s senior project Battery Management System from Cal Poly SLO computer engineering department, but we need to get it UL listed to get the permit so we have at least 10 years to get that certification before we need new batteries. We can prototype it in my EV conversion that does not have those requirements. I also wanted to do NiFe batteries; they are lower power and energy density and have only 70% efficiency instead of 90% and need hydrogen ventilation and watering like lead acid, but unlike any other battery they can be overcharged and overdischarged and not be damaged, and there have been steel cased Edison batteries that still work after 100 years with common caustic but not toxic potash electrolyte changes every 20 years which would make the ROI calculations improve dramatically. But the new ones are uncommon and nichy and seem to be all made of plastic from China and are spiked with lithium and the vendors I talked to don t deal with it so I dropped this dream this time around too. I will keep my eye out for vintage Edison batteries, some people are using them for solar. I also wanted to add solar preheat to our future water heat pump, but the energy required to heat water isn t much, the cost of the system is high due in part plumbing complexity but also lack of mass production, and at 4 x 10 it would take up a significant amount of prime solar photovoltaic panels, so we decided not to pursue that. 3
Questions and Answers Question 1: what is the payback period for a 8.7 kW solar array with a 19.2 kWh backup battery in Santa Rosa, CA? Answer: approximately 11 years if bills go up by 6% per year, 14 years if they remain flat. Question 2: is the payback period less than the warranty period? Answer: no; the warranty for solar panels is 25 years, but inverter and batteries is only 10 years. Selecting equipment with a reputation for high quality and cost effective repair support will reduce the risk of losing money, since all of these products are new. Question 3: how much electricity will be able to self-generate? Answer: approximately 73% with existing gas furnace and water heater, and approximately 57% with electric air and water heat. Since the grid is not yet clean and carbon neutral this is a significant impact that makes the risk of losing some money worth it due to the urgency of the need for change. Question 4: are the size of the solar array and battery pack the right size for optimal utilization and payback? Answer: yes, with heat pump they are on the knee of the curve for economy and performance. May add second battery with heat pump. 4
Equipment Selection High quality American made equipment with long warranties and DC solar-to-battery coupling for maximum efficiency: Sol-Ark all-in-one inverter and charge controller, Allen, TX 15K: https://www.sol-ark.com/sol-ark-15k-all-in-one/ Mission Solar solar panels, San Antonio, TX 22 x 395W: https://www.missionsolar.com/wp-content/uploads/2022/09/M6-9BB-Data-Sheets-SX9R-1.pdf HomeGrid Stack d LFP battery packs, San Jose, CA 19.2 kWh: https://www.homegridenergy.com/stackd-series S-5! Standing seam metal roof attachment system, Colorado Springs, CO S-5-U: https://www.s-5.com/products/s-5-u-clamps/ 5
Sizing The System We need a powerful enough inverter to run our home. According to PG&E data our maximum power over one hour last year was 7.01 kW, but the peaks could be twice that high easily, and that is before adding a 4 kW high efficiency heat pump. Instead of getting a very high power system and not paying attention to peak loading, we want to schedule when we do high power activities such as clothes drying, charging our EVs quickly, running the stove and oven, and eventually running our heat pump. We already try to do this for time of use by doing laundry and charging cars before 4 PM and charging our cars after 9 PM for Time-of-Use bill minimization, but it also puts a lighter load on the grid and hence doesn t drive upgrading the grid which will save cost even if everyone did it and could hasten renewable energy adoption. Adding the heat pump will be interesting, we might want to run it more during peak sun hours until 1 PM in winter, 2 PM spring/fall and 3 PM summer (if used for AC) and wear shorts and then bundle up at night. Eventually everything will be Internet-of- Things and this could be coordinated amongst the high power devices. I would like to mount large solar, battery, load and grid amp gages and a battery state-of-charge or voltage gage in the house so we can more easily manage this; I expect the Sol-Ark to have an app where I can check this on my phone. The Sol-Ark 15K has 12 kW continuous and 15 kW peak which will probably work for most situations, and when the grid is up it can do the rest. I would also like to use my old panels to help with this. 22 395 Watt Mission Solar panels totaling 8.7 kW DC fit on our roof and will provide most of the energy. One 19.2 kWh HomeGrid Stack d battery can discharge and charge at 14.4 kW continuous which can keep up with the Sol-Ark with margin, although at 12 kW continuous limited by the Sol-Ark it would only run for about 1.3 hours to get down to 80% depth of discharge. They are warranted for 4,000 cycles (designed for 10,000) down to 80% of nominal capacity at 100% depth of discharge; at 1 cycle per day that is warranted for 11.0 years and designed for 27.3 years which is probably longer than the life of the battery due to thermal breakdown so keeping it above 20% SOC is probably good enough. 6
Sizing The System 12k load management plan when off grid: Home Power Draw: 54,625 watts if all turned on at once 1.) Level II EV charging 9 PM to 5 AM only; no other high power loads during this time. This will only cause restriction when my brother comes for the day only and needs to charge. everything else, 4,289 fridge, 444 2.) Do not use more than half of the oven and stove burners at one time; no other high power loads during this time. This will cause cooking and use of clothes dryer restrictions. We currently have 240 volt, 90 amp, 21.6 kW service, with natural gas air and water heating. Before adding EVs and a heat pump it supported 39.8 kW if everything was on at once, 84% above rating. level II EV charging, 9,600 electronics, 703 fans, 774 vacuum cleaner, 800 lighting, 815 clothes washer, 909 level 1 EV charging, 981 Adding EVs and a heat pump, shown in red, totals 54.6 kW, 153% above rating. Increasing service to 125 amps would achieve a similar 82% above rating for the new all-electric configuration. coffee grinder, 1,257 dishwasher, 1,400 microwave, 1,447 double oven, 8,000 But even if we manage our loads to within 90 amp service, a grid tied system where both the grid and the inverter can power the service panel would only allow for 18 amps or 4.3 kW of solar to be added due to the "120% rule" where the rating of the breaker plus solar can not exceed 120% of the breaker rating so the bus bars do not overheat. Accomodating a 63 amp, 15 kW peak inverter would total 153 amps which corresponds to 127.5 amps rating, so a 150 amp panel would be required. other 120V cooking max (air fryer), 1,508 largest garage tool (chop saw), 1,800 beauty (hair dryer and curling iron), 1,955 Should be able to use clothes dryer and heat pump when not Level II EV charging or cooking. 4 burner stove, 7,400 air and water heat pump (est), 4,243 7 clothes dryer, 6,300
Sizing The System Setbacks are to meet fire code. 9
Sizing The System Setbacks are to meet fire code. 10
Obtaining Bids We narrowed it down to two contractors with high ratings in Sonoma County that are certified installers for the equipment that we want to use for our installation. Both proved to be mostly competitive. 11
Estimating Solar Production I used NREL s PVWatts calculator, https://pvwatts.nrel.gov/pvwatts.php, based on irradiance data taken in the region. This is the same tool I used 21 years ago to estimate the original system. I entered the system parameters and got hourly production estimate data for the old system as well as for the new system. System parameters: - Santa Rosa, CA - 8.69 kW DC - 18.4 degree tilt measured rise and run with level - 126.5 degrees azimuth, roughly southeast see map on next page It predicts 12,290 kWh annual production, similar to the 12,701 kWh predicted by Enphase s SolarGraf program that they used. We have a 21 year old 1.8 kW Sharp/SMA Sunny Boy system that is only outputting about 40%, probably due to the original inverter wearing out. I want to include this in the new system, but that has not been agreed upon yet hence it is left out of the calculations. 12
Estimating Solar Production Southeast roof surface East = 90 degrees clockwise from North 90-A = 36.5 degrees A 90 degrees A = tan-1(9.125/6.75) = tan-1(1.35185) = 53.5 degrees 90 + 36.5 = 126.5 degrees clockwise from North = azimuth A 13
Estimating Solar Production Estimated Daily Solar Production 60 max day 158 June 7 58.2 kWh mid way fall sunny day 260 Sept 17 44.6 kWh 77% of peak mid way spring sunny day 68 Mar 9 44.1 kWh 76% of peak 50 40 Daily Solar Production, kWh min sunny day 346 Dec 12 26.4 kWh 45% of peak 30 20 10 0 0 10 20 30 40 50 60 70 80 90 100110120130140150160170180190200210220230240250260270280290300310320330340350360370 14 Day Number
Estimating Loads First I started with our 2023 PG&E net hourly electric data. Then I added in 40% of the model data from PVWATTS of our old system, the performance level I think it s at from spot checking over the last couple of years. There is also shade problems with a tall Valley oak tree, but I estimate the output now to be only about 10% of the new system, so even if I m 50% off that s only 5% of the new system. For the heat pump scenario I took the daily PG&E gas usage data which has poor resolution, only rounded off to the nearest therm which may not tick up for a few days in the summer when we are only using hot water, and averaged it over each month, then applied it smoothly across the 24 hours. This is not accurate since our heater is not on at night, but it made calculations easy. Then I converted the daily therms reported by PG&E to kWh by multiplying by 29.3; our furnace is 95% so this number is 5% high. I then divided by an estimated average Coefficient of Performance of 2.6, which I estimate is what the advanced Chilltrix heat pump will do in this climate that can run well below freezing without resistive heat due to an additional pump stage and variable frequency drive, 30% better than the competition they claim but I tried to get someone to install one in 2022 but I couldn t find anyone certified to do it. It transfers via glycol so I could do it myself but decided I wanted someone to service it in situ so I will wait patiently for them to be available here. Like triple pane windows they are being deployed in colder climates, but they can enable us to go all electric with less infrastructure upgrades. 15
PG&E Electric Rate History PG&E Time of Use Schedule E6 Baseline Rate per kWh 2008-2024 $0.60000 To estimate payback period we first need to estimate where energy bills are going. $0.50000 This shows baseline rates have been going up exponentially over the past 10 years, and upper tiers have gone up at even faster rates, so this is conservative. Source: https://www.pge.com/tariffs/elec tric.shtml $0.40000 $0.30000 $0.20000 $0.10000 $0.00000 Jan-08 Jan-09 Jan-10 Jan-11 Jan-12 Jan-13 Jan-14 Jan-15 Jan-16 Jan-17 Jan-18 Jan-19 Jan-20 Jan-21 Jan-22 Jan-23 summer peak summer part peak summer off peak winter part peak winter off peak 16
PG&E Electric Rate History PG&E Time of Use Schedule E6 Baseline Annual Rate per kWh Change 2008-2024 10% 8% This shows the annual rate change climbing up to 6% exponentially. Who knows what will happen, so I am using a conservative guess that they will be least 6% for the next 10 years during the warranty period. 6% 4% If they go back down that will be a good thing for the masses and I can tell the story of how I lost my shorts on my install, but how much I value how much less greenhouse gases I have used. If everyone waits for a good deal it may be too late. 2% 0% -2% -4% Jan-08 Jan-09 Jan-10 Jan-11 Jan-12 Jan-13 Jan-14 Jan-15 Jan-16 Jan-17 Jan-18 Jan-19 Jan-20 Jan-21 Jan-22 Jan-23 summer peak summer part peak summer off peak winter part peak winter off peak 17
Estimating System Performance and Payback I made a spreadsheet that I posted here: http://thjmedia.net/blog/posts/Solar/solar%20payback%20v1%20b2.xlsx . It has the following inputs and outputs: Inputs Value I settled on Annual Outputs Without Heat Pump With Heat Pump DC size, kW 8.69 Same Watts per panel 395 Solar production, kWh 12,289 Same Number of panels 22 Load, kWh 8,093 13,869 +71% Battery capacity, kWh 19.2 Max battery state of charge 100% Solar direct to load, kWh 2,572 32% of load 4,212 30% of load Min battery state of charge 20% Battery to load, kWh 3,406 42% of load 3,682 27% of load Battery round trip efficiency 90% Heat pump Coefficient of Performance 2.6 Grid to load, kWh 2,163 27% of load 73% self gen 68% if SOC 40% min 6,031 43% of load 57% self gen 53% if SOC 40% min $2,994 Old annual electric bill if no old solar 6% Bill increase year 1 6% Rate rise subsequent years Solar to battery, kWh 3,776 4,074 $191 Fixed electric cost year 1 5,941 4,004 Solar to grid, kWh $0.33 Cost per kWh year 1 11 years 14 years 11 years 14 years Payback period at 6% rate rise per year 0% $0.08 Payment per kWh year 1 $41,124 System cost 10 Min warranty, years 18
Estimating System Performance and Payback Calculations in hourly_calcs_no_hp tab without heat pump and hourly_calcs_with_hp tab with heat pump : Columns Calculations Notes A-N Consumption, without and with heat pump Source: PG&E hourly consumption in 2023 CSV file O-P Solar generation Source: PVWATTS model CSV file Q-U Starting battery capacity From previous hour, calculated in kWh and SOC% and compared to min and max limits. V-X Priority 1.) Solar to load If there is any solar and any load, transfer the lesser of the two from solar to load. Y-AB Priority 2.) Battery to load If there is any load and available battery capacity left, transfer the lesser of the two from battery to load. AC Priority 3.) Grid to load If there is any load left, transfer it from the grid. AD-AG Priority 4.) Solar to battery If there is any solar and battery charging capacity left, transfer the lesser of the two from solar to battery. AH Priority 5.) Solar to grid If there is any solar left, export it to the grid. 19
Estimating System Performance and Payback Thurs Mar 9 Hourly System Performance - No Heat Pump 10 9 8 7 kWh or Battery Capacity % /10 6 5 4 3 2 1 0 0:00 1:00 2:00 3:00 4:00 5:00 6:00 7:00 8:00 9:00 10:00 11:00 12:00 13:00 14:00 15:00 16:00 17:00 18:00 19:00 20:00 21:00 22:00 23:00 Hourly Starting Time battery capacity max battery capacity min battery capacity load solar generation 1.) solar to load 2.) battery to load 3.) grid to load 4.) solar to battery 5.) solar to grid 20
Estimating System Performance and Payback Thurs Mar 9 Hourly System Performance - With Heat Pump 10 9 8 7 kWh or Battery Capacity % /10 6 5 4 3 2 1 0 0:00 1:00 2:00 3:00 4:00 5:00 6:00 7:00 8:00 9:00 10:00 11:00 12:00 13:00 14:00 15:00 16:00 17:00 18:00 19:00 20:00 21:00 22:00 23:00 Hourly Starting Time battery capacity max battery capacity min battery capacity load solar generation 1.) solar to load 2.) battery to load 3.) grid to load 4.) solar to battery 5.) solar to grid 21
Estimating System Performance and Payback Wed June 7 Hourly System Performance - No Heat Pump 10 9 8 7 kWh or Battery Capacity % /10 6 5 4 3 2 1 0 0:00 1:00 2:00 3:00 4:00 5:00 6:00 7:00 8:00 9:00 10:00 11:00 12:00 13:00 14:00 15:00 16:00 17:00 18:00 19:00 20:00 21:00 22:00 23:00 Hourly Starting Time battery capacity max battery capacity min battery capacity load solar generation 1.) solar to load 2.) battery to load 3.) grid to load 4.) solar to battery 5.) solar to grid 22
Estimating System Performance and Payback Wed June 7 Hourly System Performance - With Heat Pump 10 9 8 7 kWh or Battery Capacity % /10 6 5 4 3 2 1 0 0:00 1:00 2:00 3:00 4:00 5:00 6:00 7:00 8:00 9:00 10:00 11:00 12:00 13:00 14:00 15:00 16:00 17:00 18:00 19:00 20:00 21:00 22:00 23:00 Hourly Starting Time battery capacity max battery capacity min battery capacity load solar generation 1.) solar to load 2.) battery to load 3.) grid to load 4.) solar to battery 5.) solar to grid 23
Estimating System Performance and Payback Sun Sept 17 Hourly System Performance - No Heat Pump 10 9 Load spikes probably EV charging and/or clothes drying 8 7 kWh or Battery Capacity % /10 6 5 4 3 2 1 0 0:00 1:00 2:00 3:00 4:00 5:00 6:00 7:00 8:00 9:00 10:00 11:00 12:00 13:00 14:00 15:00 16:00 17:00 18:00 19:00 20:00 21:00 22:00 23:00 Hourly Starting Time battery capacity max battery capacity min battery capacity load solar generation 1.) solar to load 2.) battery to load 3.) grid to load 4.) solar to battery 5.) solar to grid 24
Estimating System Performance and Payback Sun Sept 17 Hourly System Performance - With Heat Pump 10 9 Load spikes probably EV charging and/or clothes drying 8 7 kWh or Battery Capacity % /10 6 5 4 3 2 1 0 0:00 1:00 2:00 3:00 4:00 5:00 6:00 7:00 8:00 9:00 10:00 11:00 12:00 13:00 14:00 15:00 16:00 17:00 18:00 19:00 20:00 21:00 22:00 23:00 Hourly Starting Time battery capacity max battery capacity min battery capacity load solar generation 1.) solar to load 2.) battery to load 3.) grid to load 4.) solar to battery 5.) solar to grid 25
Estimating System Performance and Payback Tue Dec 12 Hourly System Performance - No Heat Pump 10 9 Load spike probably EV charging and/or clothes drying 8 7 kWh or Battery Capacity % /10 6 5 4 3 2 1 0 0:00 1:00 2:00 3:00 4:00 5:00 6:00 7:00 8:00 9:00 10:00 11:00 12:00 13:00 14:00 15:00 16:00 17:00 18:00 19:00 20:00 21:00 22:00 23:00 Hourly Starting Time battery capacity max battery capacity min battery capacity load solar generation 1.) solar to load 2.) battery to load 3.) grid to load 4.) solar to battery 5.) solar to grid 26
Estimating System Performance and Payback Tue Dec 12 Hourly System Performance - With Heat Pump 10 9 Load spike probably EV charging and/or clothes drying 8 7 kWh or Battery Capacity % /10 6 5 4 3 2 1 0 0:00 1:00 2:00 3:00 4:00 5:00 6:00 7:00 8:00 9:00 10:00 11:00 12:00 13:00 14:00 15:00 16:00 17:00 18:00 19:00 20:00 21:00 22:00 23:00 Hourly Starting Time battery capacity max battery capacity min battery capacity load solar generation 1.) solar to load 2.) battery to load 3.) grid to load 4.) solar to battery 5.) solar to grid 27
Equipment Size Optimization Then I varied number of solar panels and battery pack size, estimating the cost would vary linearly with each change which is a crude assumption, to make sure I was close to the knee of the curve of cost and performance payback. I was past the knee without heat pump but still climbing with heat pump, so increasing capacity should pay, but it would be nice to see the actual solar, battery and heat pump performance first. Thus we will have the 19.2 kWh battery installed such that it would not be a redo to add a second battery, and the panel upgrade needs to have enough capacity to run the heat pump. We could even add more solar where the old system was on the SW roof; an overgrown tree shades that area much of the year, but it is growing in to the power lines and keeps getting cut back by PG&E so it may not be a problem in the future if we replace it with a shorter tree. Also adding or shifting solar to the SW roof may help skew production better to avoid relying on mornings that are often foggy here. If peak power is a problem caused by charging EVs we can get a charging station with programmable power limits to smooth out the charging power. 28
Equipment Size Optimization Self Powered Ratio vs. Number of Solar Panels with 19.2 kWh Battery 100% 90% 80% 70% 60% Self Powered 50% 40% 30% 20% 10% 0% 0 5 10 15 20 25 Number of 395W Solar Panels off grid no HP off grid with HP 29
Equipment Size Optimization Payback Period vs. Number of Solar Panels with 19.2 kWh Battery 20 19 18 17 16 15 14 13 Payback Period, years 12 11 10 9 8 7 6 5 4 3 2 1 0 0 5 10 15 20 25 Number of 395W Solar Panels payback no HP payback with HP warranty 30
Equipment Size Optimization System Cost vs. Number of Solar Panels with 19.2 kWh Battery $60,000 $50,000 $40,000 System Cost $30,000 $20,000 $10,000 $0 0 5 10 15 20 25 Number of 395W Solar Panels total cost 31
Equipment Size Optimization Self Powered Ratio vs. Battery Capacity with 22 395W Panels 100% 90% 80% 70% 60% Self Powered 50% 40% 30% 20% 10% 0% 0 5 10 15 20 25 30 35 40 Battery capacity, kWh off grid no HP off grid with HP 32
Equipment Size Optimization Payback vs. Battery Capacity with 22 395W Panels Assuming 6% Rate Annual Increase 20 19 18 17 16 15 14 13 12 Payback, years 11 10 9 8 7 6 5 4 3 2 1 0 0 5 10 15 20 25 30 35 40 Battery capacity, kWh payback no HP payback with HP warranty 33
Equipment Size Optimization Total Cost vs. Battery Capacity with 22 395W Panels $60,000 $50,000 $40,000 System Cost $30,000 $20,000 $10,000 $0 0 5 10 15 20 25 30 35 40 Battery capacity, kWh total cost 34
Power Backup Estimate Normally we will want to be on minimize grid mode, but in case of an upcoming fire or storm related power outage expected we will charge up our batteries and keep them full so we can use them for several days. If we use 80% of the battery or 15.36 kWh, the fridge that runs at 60W average would run for 10.6 days. If the fiber to the house was working the network would probably take less than that plus charging laptops and occasional lighting so maybe we could run 5 days. If we get the second 19.2 kWh battery when we get the heat pump maybe we can run 10 days. If we want to do some electric cooking that would be high power but very quick for instance the 1447W microwave running for 5 minutes is 120 Wh so if we cooked 4 servings a day that would be 480 Wh or 20W average so only 1/3 of the fridge so might be considered although we could cook with our gas camping stove or charcoal BBQ. But if it is sunny or even partially blocked by clouds or fire smoke, we should be able to power our fridge and network always by having the solar recharge the battery while off grid. The system will put out at least 26 kWh per day on a sunny winter day that is much more energy than 1.4 kWh to run the fridge. 35