Solid Waste Management Data Analysis and Cost Comparisons
Explore annual budgets, disposal expenses, income sources, and cost projections related to solid waste management in Kingston. Analyze key metrics like tonnages, sticker fees, and cost per household to understand the financial aspects of waste disposal and potential savings with a volume-based system.

Download Presentation

Please find below an Image/Link to download the presentation.
The content on the website is provided AS IS for your information and personal use only. It may not be sold, licensed, or shared on other websites without obtaining consent from the author. If you encounter any issues during the download, it is possible that the publisher has removed the file from their server.
You are allowed to download the files provided on this website for personal or commercial use, subject to the condition that they are used lawfully. All files are the property of their respective owners.
The content on the website is provided AS IS for your information and personal use only. It may not be sold, licensed, or shared on other websites without obtaining consent from the author.
E N D
Presentation Transcript
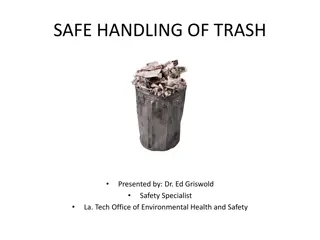
Kingston Trash Information
Yearly Transfer Station Budget All data is provided for fiscal years beginning July 1 2011 $436,754 2012 $473,466 2013 $460,234 2014 $424,658 ($35,576 decrease from prior year) 2015 $512,965 ($88,307 increase over prior year) 2016 $508,556 ($4,409 decrease from prior year due to change to new employees)
Yearly Disposal Expenses 2011 trash tonnage 3510 2012 trash tonnage 3341 2013 trash tonnage 3159 2014 trash tonnage 3054 2015 trash tonnage 3000 2016 trash tonnage 3000 X $35.56/ton = $124,816 X $35.56/ton = $118,806 X $35.56/ton = $112,334 X $35.56/ton = $108,600 (13% reduction since 2011) X $35.56 for 6 months, X $70 for 6 months = $158,340 X $70/ton = $210,000 In addition, the town pays around $20 per ton to sort and recycle the bottles, cans and rigid containers. 2012 190 tons X $20/ton = $3800 2013 183 tons X $20/ton = $3660 2014 203 tons X $20/ton = $4060
Yearly Income to Solid Waste Sticker fees 2011 $376,148 2012 $367,029 2013 $359,276 2014 $415,202 (2968 sold in 2014) 2015 $400,240 Other fees and rebates (cardboard, paper, tires, metals, electronics, etc.) 2011 $44,866 2012 $41,560 2013 $45,350 2014 $35,677 2015 $51,432 (to date)
Cost Comparisons Trash disposal fee is $70 per ton effective 1/1/15 Current cost per household is $173 $512,965/2968 households = $173 3842 tons of trash/2968 households = 1.3 tons per household 3054 tons to SEMASS @ $70 + $2.87 (staff, gas, etc.) = $222,545 Cost projections per household if a volume based system is adopted, based on .57 tons/household/year disposed in area PAYT towns is $140 $414,299/2968 households = $140 1700 tons/2968 households = .57 tons per household 1700 tons to SEMASS @ $70 + $2.87 = $123,879 ($98,666 savings)