Solving Linear Systems through Graphing: Unit 6 Review
Learn to solve linear systems with two variables through algebraic elimination and graphing. Practice problems and real-world scenarios enhance your understanding. Enhance your graphing skills by solving linear inequalities in two unknowns.
Download Presentation

Please find below an Image/Link to download the presentation.
The content on the website is provided AS IS for your information and personal use only. It may not be sold, licensed, or shared on other websites without obtaining consent from the author. If you encounter any issues during the download, it is possible that the publisher has removed the file from their server.
You are allowed to download the files provided on this website for personal or commercial use, subject to the condition that they are used lawfully. All files are the property of their respective owners.
The content on the website is provided AS IS for your information and personal use only. It may not be sold, licensed, or shared on other websites without obtaining consent from the author.
E N D
Presentation Transcript
Review of Linear Systems with Graphing Unit 6
Learning Objectives 1. Solve linear systems consisting of two simultaneous equations in two variables using algebraic elimination 2. Graph linear equalities in two variables 3. Graph linear systems consisting of two linear relations in two variables 4. Solve problems by setting up systems of linear equations in two variables
Solving Linear Systems with Two Variables Any linear system that consists of two equations in two variables can be solved algebraically or graphically Solving a system of two equations requires finding a pair of values for the two variables that satisfies both of the equations Algebraic and graphic solutions of systems of linear equations in two variables are used extensively when doing break-even analysis
Practice Problems Similar to what we did in Unit 2 where we solved as a system of linear equations. 1. 6.5x + 3.5y = 128 2.5x + 4.5y = 106 ? 4+ 3? 7= 2 21 2? 3+ 3? 2= 7 and 2. 36
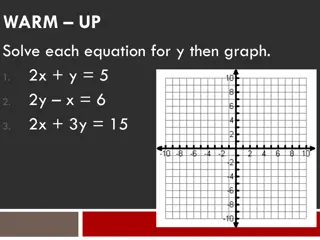
Graphing Linear Systems of Equations in Two Unknowns Q1. 6x + 3y = 300 for x=0 to x=50 and 4x+8y=160 for x=0 to x=80 We will do this one together
Problem Solving Q1. A machine requires four hours to make a unit of Product A and three hours to make a unit of Product B. Last month the machine operated for 200 hours, producing a total of 60 units. How many units of each type of product did it produce? Q2. A company has two plants: plant 1 and plant 2. Product 1 requires 3 hours of processing time at plant 1 and 4 hours at plant 2. Product 2 requires 4 hours of processing time at plant 1 and 6 hours at plant 2. Plant 1 has 30 hours of processing time available and plant 2 has 40 hours. How many units of each product will the company produce? (The wording on this problem seems a little trickier than Q1 but in reality both are approached similiarly) Notice how it looks very similar to a unit 2 problem!
Graphing Inequalities Recommended Problems Question 1. Graph the region where x - 2y < 4 and x > -3 Question 2 Graph the region where 5x > -3y and 2x 5y > 10 This is a doing type of problem First, we graph the line (i.e. pretend it is an equality relationship) Second, we check if the inequality area is above or below the line or to the right or left of the line. Using the origin is useful here - (0,0) is an easy coordinate to use
Summary Linear systems of two simultaneous equations in two variables are useful for modeling business applications Such systems can be solved by graphing the two linear equations and finding the point of intersection Such systems can be solved algebraically by using the method of elimination

