Spatial Analysis Techniques in ArcGIS for Elevation and Precipitation Data
Explore the process of slope calculations, verification using ArcGIS, automation with ModelBuilder, and analysis of San Marcos elevation and precipitation data. Learn about projecting rasters, topography visualization, zonal average calculations, Thiessen polygons, and more.

Download Presentation

Please find below an Image/Link to download the presentation.
The content on the website is provided AS IS for your information and personal use only. It may not be sold, licensed, or shared on other websites without obtaining consent from the author. If you encounter any issues during the download, it is possible that the publisher has removed the file from their server.
You are allowed to download the files provided on this website for personal or commercial use, subject to the condition that they are used lawfully. All files are the property of their respective owners.
The content on the website is provided AS IS for your information and personal use only. It may not be sold, licensed, or shared on other websites without obtaining consent from the author.
E N D
Presentation Transcript
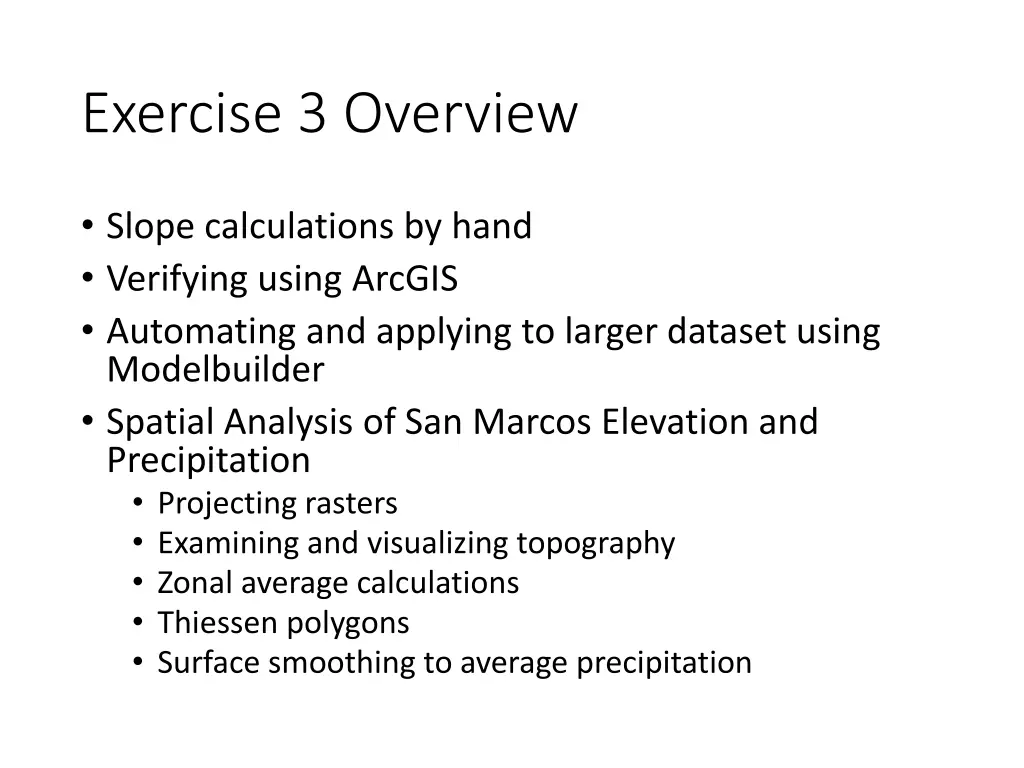
Exercise 3 Overview Slope calculations by hand Verifying using ArcGIS Automating and applying to larger dataset using Modelbuilder Spatial Analysis of San Marcos Elevation and Precipitation Projecting rasters Examining and visualizing topography Zonal average calculations Thiessen polygons Surface smoothing to average precipitation
Slope and Aspect ? ? ? = aspect clockwise from North ? ? ? https://pro.arcgis.com/en/pro-app/tool-reference/spatial-analyst/how-slope-works.htm
ArcGIS Slope tool y a b c +? ? 2 2 ? ? 2 +? ? 2 2 ? ? 2 d e f + 2 g h i x dz dx= a + 2d + g c + 2f + i 8 ? ? 2 Similarly ? ? 2 dz dy= g + 2h + i a + 2b + c 8 ? ? 2 c b f Slope magnitude = a e i 2 2 d h ?? ?? ?? ?? + g 2 x y
ArcGIS Aspect the steepest downslope direction dz dz / dx x ? = = atan atan dy dz / dy y dz ? = ? dx ? ? Use atan2 to resolve ambiguity in atan direction ? + 180? ( ) , y atan2 x ? ? https://pro.arcgis.com/en/pro-app/tool-reference/spatial-analyst/how-aspect-works.htm
Example dz = 30 + * 8 + + + (a 2d g) - (c 2f i) a b c dx x_mesh_spa cing 80 74 63 + + + + 80 ( 2 * 69 60 ) ( 63 2 * 56 48 ) = d e f 145.2o 8 * 30 69 67 56 = . 0 229 + g h i i) + 2b + + dz (g 2h - (a c) 60 52 48 = dy y_mesh_sp * 8 + acing + + + ( 60 2 * 52 48 ) 80 ( 2 * 74 63 ) = = + 8 * 30 2 2 Slope . 0 229 . 0 329 = . 0 329 = . 0 401 = o atan . 0 ( 401 ) 21 8 . + o 180 . 0 229 = = o Aspect atan 34 8 . o . 0 329 145 2 .
Hydrologic Slope (Flow Direction Tool) - Direction of Steepest Descent 30 30 80 74 63 80 74 63 69 67 56 69 67 56 60 52 48 60 52 48 67 48 67 52 = Slope: . 0 45 = . 0 50 30 2 30
Eight Direction Pour Point Model 32 64 128 16 1 8 4 2 ESRI Direction encoding
The D Algorithm Steepest direction downslope z0 Elevations at each vertex zi z2 z1 3 2 4 2 z z = atan 1 2 1 0 1 z z 1 5 0 1 2 2 z z z z 8 = + 0 1 S 1 2 6 7 If 1 does not fit within the triangle the angle is chosen along the steepest edge or diagonal resulting in a slope and direction equivalent to D8
D Example 30 z z 80 74 63 = 7 8 atan 1 z z 0 7 eo 52 48 69 67 56 = = o atan 14 9 . 67 52 e8 e7 60 52 48 2 2 52 48 67 52 284.9o = + S 30 30 14.9o = . 0 517 From ArcGIS Pro Help:
10 z0 4 3 2 ?5 ?6 ?0 ?5 ? = atan z5 5 1 26.0 26.4 ? 2 2 ?5 ?6 ?? ?5 ? = + 6 25.8 7 8 z6
Subwatershed Precipitation by Thiessen Polygons P2 Thiessen Polygons Intersect with Subwatersheds Evaluate A*P Product Summarize by subwatershed P1 A2 A1 A3 P3 ? =?1 ?1 + ?2 ?2 + ?3 ?3 ?1 + ?2 + ?3
Subwatershed Precipitation by Thiessen Polygons Thiessen Polygons Intersect with Subwatersheds Evaluate A*P Product Summarize by subwatershed ??= ?????? ????


")


