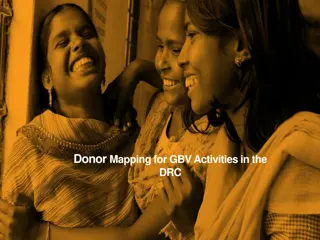
Spatial and Financial Barriers to Healthcare Access in DRC
Spatial data and GIS techniques to understand access to healthcare, identify underserved areas for service expansion, and highlight financial costs of seeking care in Haut-Katanga district, DRC.

Download Presentation

Please find below an Image/Link to download the presentation.
The content on the website is provided AS IS for your information and personal use only. It may not be sold, licensed, or shared on other websites without obtaining consent from the author.If you encounter any issues during the download, it is possible that the publisher has removed the file from their server.
You are allowed to download the files provided on this website for personal or commercial use, subject to the condition that they are used lawfully. All files are the property of their respective owners.
The content on the website is provided AS IS for your information and personal use only. It may not be sold, licensed, or shared on other websites without obtaining consent from the author.
E N D
Presentation Transcript
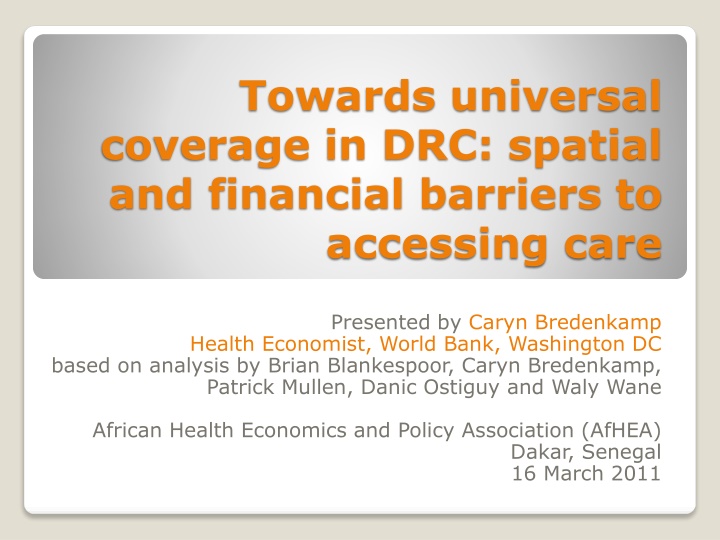
Towards universal coverage in DRC: spatial and financial barriers to accessing care Presented by Caryn Bredenkamp Health Economist, World Bank, Washington DC based on analysis by Brian Blankespoor, Caryn Bredenkamp, Patrick Mullen, Danic Ostiguy and Waly Wane African Health Economics and Policy Association (AfHEA) Dakar, Senegal 16 March 2011
Not on track to meet the MDGs 1c, 4 and 5 Health outcomes are improving, but remain poor: - - 45.5% of children are chronically malnourished - - under-five mortality is 148 per 1,000 live births - - maternal mortality ratio is 549 per 100,000 live births Coverage of many high impact interventions, especially preventive, is low: - 31% of one-year-old children are fully immunized - 6% of under-five children sleep under insecticide- treated bednets => Demand-side barriers - financial and spatial - to accessing care Source: DHS 2007
Objective 1. Explore how spatial data and GIS techniques can be used to broaden our understanding of physical/spatial access to health care 2. Identify the areas that are insufficiently served by primary health care services in order to inform decisions about service expansion 3. Highlight financial costs of seeking care
Study area Site of a PBF intervention District of Haut- Katanga ~1.350.000 population 5 hospitals 3 hospital-like referral centers 4 referral health centers 148 health centers and health posts 85 public, 31 faith-based facilities 44 private facilities
Data sources Baseline data from PBF impact evaluation Sept-Oct 2009 - Household survey - Community survey - Patient exit interviews - Facility surveys with staff interviews - GPS coordinates Secondary GPS data
Measuring spatial access to care
Data description I Primary data collection: GPS coordinates of health facilities were collected - as part of the baseline Hand-drawn maps of the boundaries of health zones and health areas were obtained from the chief doctors of the health zones in Haut-Katanga
Data description II Secondary data collection: Geographic Information System (GIS) data Road networks from multiple sources Village locations Administrative units Hydrography Elevation Slope
Methods I Obtain GPS coordinates of health facilities from baseline survey Create health area boundaries by digitizing paper maps that includes population information
Methods II 3. Define catchment area Includes all villages/settlements that are closest to the particular health facility relative to all other facilities 4. Integrate road network information to estimate travel time. First, by using data on the GPS coordinates of health facilities and villages/settlements, and adding known transportation routes, we are able to build a spatial model that estimates average travel time to the health centers for each village using GIS data based on an approach by Nelson (2008). 5. Summarize information on population to display the distribution of population among the health centers Nelson, A. 2008. Travel time to major cities: A global map of Accessibility. Global Environment Monitoring Unit - Joint Research Centre of the European Commission, Ispra Italy. Available at http://gem.jrc.ec.europa.eu
Inequalities in distribution of facilities Non-standard catchment areas: vary tremendously, both in terms of size (28 5,900 km2) and population size (5 000 people to 60 000 people). Most facilities are located along the main roads - especially public health facilities. The distribution of facility types is very uneven Most private facilities are concentrated around Lubumbashi. Mix of facility types also varies a lot Health facility type Public Private NGO Faith-based Road Asphalt Track Trail other Population (1000s) > 40 5 - 10 0 - 5 No data 10 - 20 20 - 40 0 20 40 80 Kilometers
Inequalities in travel time " ) " ) " ) Translate road-type information into travel time using method of Nelson (2008) => map " ) " ) Assume even population distribution by health area, find: Population with more than 4 hours travel time to nearest facility: 610,000 Population with less than 4 hours travel time: 483,000 " ) " )" )" ) " ) " ) " ) " ) Health area Referral health centre / hospital " ) Settlement point population would improve the health area population estimates Travel time (hrs) < 1 1 - 2 2 - 3 3 - 4 > 4 0 30 60 120 Km
Adding information from household surveys and exit interviews A more nuanced picture of access
Patient exit interviews confirm that distance is a key determinant of service utilization Why did you visit this facility? Source: Patient exit interviews
Most users / patients dont travel far to get there
Most travel by foot Type of transportation used to reach facility (exit interviews) Autre 7 A pied 608 Charrette 6 Bicyclette 186 transport public 24 voiture, moto 41 0 100 200 300 400 500 600 700 Implication: It is likely that most households in the green areas are hardly accessing care (as expected)
This is confirmed by travel cost information Number of patients who incurred transportation costs 54 Oui Non 818
Costs of care dominated by consultations and medicines 4500 4000 3500 3000 Consultations Dons M dicaments Tests Transport 2500 2000 1500 1000 500 0 CS public CS priv CS confessionnel Gu risseur trad. Source: Household survey
So, given the barriers, how high are utilization rates? Number of people using primary care in the last four weeks: - Public 436 - Private 247 - Faith-based 80 - Traditional 113 - Total 876 out of 6817 people (12.9%) Source: Household survey
Conclusion The population in Haut-Katanga faces substantial spatial barriers to accessing care. These include great distances to primary and referral health facilities and a poor road network that contribute to long travel times With relatively little additional data collection and even without household surveys - much can be learnt about a population s spatial access to care But, patient interviews and household surveys add useful additional information costs of accessing care, and utilization rates
Acknowledgments Funding for the data collection of this project was provided by the Health Results Innovation Trust Fund (HRITF), World Bank. The findings, interpretations, and conclusions expressed on this poster are entirely those of the authors. For further information Please contact bblankespoor@worldbank.orgor cbredenkamp@worldbank.org. More information on related research projects can be obtained at http://econ.worldbank.org; http://www.worldbank.org/hnp; and http://www.rbfhealth.org