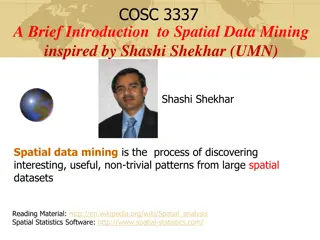
Spatial Data Analysis and Visualization Training at Columbia
In the Columbia Collaboratory, a team collaborates to develop courses for data scientists in various disciplines. A new course focuses on spatial data analysis and visualization, incorporating basic mapping techniques, geo-referencing, and more. The training program includes visits to newsrooms to observe mapping practices and emphasizes the integration of narrative and spatial skills to enhance digital literacy.

Uploaded on Mar 17, 2025 | 2 Views
Download Presentation

Please find below an Image/Link to download the presentation.
The content on the website is provided AS IS for your information and personal use only. It may not be sold, licensed, or shared on other websites without obtaining consent from the author.If you encounter any issues during the download, it is possible that the publisher has removed the file from their server.
You are allowed to download the files provided on this website for personal or commercial use, subject to the condition that they are used lawfully. All files are the property of their respective owners.
The content on the website is provided AS IS for your information and personal use only. It may not be sold, licensed, or shared on other websites without obtaining consent from the author.
E N D
Presentation Transcript
CS5100 Advanced Computer Architecture Performance Evaluation Prof. Chung-Ta King Department of Computer Science National Tsing Hua University, Taiwan (Slides are from textbook, Prof. Hsien-Hsin Lee, Prof. Yasun Hsu) National Tsing Hua University
Outline Goal of this lecture: To learn how to evaluate the performance of computers as the basis of a quantitative approach to computer design Know performance evaluation and understand the implications behind the numbers Lecture outline Measuring, reporting, summarizing performance (Sec. 1.8) Quantitative principles of computer design (Sec. 1.9) 1 National Tsing Hua University
Which Device Has the Best Performance? 2 National Tsing Hua University
Things to Clarify What do you mean by performance ? How to quantify the performance? What performance metrics to use? Best performance Best! How to measure the performance ? What configurations of the devices are used? What workloads are used? How to get the performance data? How to summarize and compare the performance? A total ordering needed How to report the results? 3 National Tsing Hua University
Which Design is Better? P0 P1 P2 P3 P0 P1 P2 P3 L1$ L1$ L1$ L1$ L1$ L1$ L1$ L1$ Bus Bus L2$ Memory Memory 4 National Tsing Hua University
Things to Clarify What do you mean by better ? How to estimate the performance of designs, even before hardware is ready and software is running? What kinds of tools are available? At what level of details do you want the performance be studied? e.g. get performance data only or get correct execution outputs also, specific component or whole system, accurate to clock cycle or to function, single application or OS+applications, 5 National Tsing Hua University
What Do You Mean by Performance? Many performance metrics: GHz, number of cores MIPS (million instructions per second) MFLOPS (million floating-point operations per second) Time is the primary measure of performance Execution/response time (latency) vs. throughput (BW) Wall clock time: latency to complete a task, including all system overheads CPU time: the time that the processor is computing, not including I/O or running other programs Single program vs. whole system 6 6 National Tsing Hua University
CPU Performance (of a Program) Execution Time = Seconds/Program seconds Instructio program ns cycles = Instructio n cycle CPI Programmer Algorithms ISA Compilers Microarchitecture System architecture Microarchitecture, pipeline depth Circuit design Technology 7 National Tsing Hua University
Cycles Per Instruction (CPI) CPI = Cycles / Instruction Count = (CPU Time * Clock Rate) / Instruction Count n CPU time = CycleTime CPIi Ii How about pipelined processors? i = 1 Alternative formula: instruction frequency CPI = CPIi Fj where Fj = Ij i = 1 n Instruction Count 8 National Tsing Hua University
Example: Calculating CPI Run benchmarks, collect workload characterization (by simulation, machine counters, or sampling) Base Machine (Reg - Reg) Op ALU Load Store Branch Freq 50% 20% 10% 20% Cycles CPI(i) 1 2 2 2 (% Time) (33%) (27%) (13%) (27%) .5 .4 .2 .4 1.5 9 9 National Tsing Hua University
Accounting Stalls CPI = CPIideal + CPIstall CPIideal: cycles per instruction if no stall CPIstall contributors Data dependences: RAW, WAR, WAW Structural hazards Control hazards: branches, exceptions Memory latency: cache misses 10 National Tsing Hua University
New Breed of Metrics Performance/Watt Performance achievable at the same cooling capacity Performance/Joule (Energy) Achievable performance at the lifetime of the same energy source (i.e., battery = energy) Equivalent to reciprocal of energy-delay product (ED product) 11 11 National Tsing Hua University
Outline of Performance Evaluation What do you mean by performance ? Performance metrics What to evaluate? Workloads, benchmarks How to evaluate? How to summarize and report? 12 National Tsing Hua University
Performance Benchmarking Benchmark: a standard of measurement as a reference point for comparison Model real job mix with a small set of representative programs Kernels: Small key pieces of real programs, e.g. Linpack Best used to isolate performance of individual features (Toy) programs: Typically 10 to 100 lines to test a special function and/or its performance, e.g. quicksort, matrix multiply 13 National Tsing Hua University
Performance Benchmarking Synthetic benchmarks: Try to match the average frequency and operation of a large set of programs , e.g. Dhrystone, Whetstone (Real) programs Having inputs, outputs, and options; running on standard OS, e.g. SPEC2006, TPC-C, SYSMARK, 3D Winbench Often come with a suite 14 14 National Tsing Hua University
Benchmark Suites: SPEC SPEC goal: a fair and useful set of metrics to compare performance www.spec.org SPECCPU: popular desktop benchmark suite CPU only, split between integer and floating-point programs, where SPECint2006 has 12 integer, SPECfp2006 has 17 floating-point programs Use geometric mean SPECSFS (NFS file server) and SPECWeb (WebServer) added as server benchmarks (mainly for I/O: disk and network) 15 National Tsing Hua University
Benchmark Suites TPC (Transaction Processing Council) measures server performance and cost-performance for databases TPC-C Complex query for Online Transaction Processing Metrics: # transactions per sec and response time EEMBC (EDN embedded Microprocessor Benchmark Consortium) Set of 41 kernels for performance of embedded applications Benchmarks for mobile phones: Quadrant, AnTuTu, CFBench, MobileBench 16 National Tsing Hua University
Some Warnings about Benchmarking Benchmarks reflect yesterday s programs Benchmarks can lead to positive feedbacks If you make an operation fast (slow), it will be used more (less) often; so you make it faster (slower), and so on Tricks and common mistakes in benchmarking: Different system configurations Compiler and libraries optimized for benchmarks Workload/inputs arbitrarily picked Very small benchmarks ignore caching effects Only average behavior represented in test workload Ignoring monitoring overhead Too much data but too little analysis 17 National Tsing Hua University
Outline of Performance Evaluation What do you mean by performance ? Performance metrics What to evaluate? Workloads, benchmarks How to evaluate? How to summarize and report? 18 National Tsing Hua University
To Evaluate Real Machines Run the benchmark and obtain performance How to measure program execution time? How to obtain instruction count? How to separate effects of OS, virtual machine, and measuring tool itself? Programs use timer API Instrumentation PinTool: dynamic binary instrumentation engine for Intel x86 Performance monitor and profiler Oprofile: monitor HW/SW events through CPU perf. counters Linux perf 19 National Tsing Hua University
Instrumentation A technique that inserts code into a program to collect run-time information Source code instrumentation Static binary instrumentation Dynamic binary instrumentation Tevi Devor, Intel 20 National Tsing Hua University
To Evaluate Designs Scope: full system vs. component Component simulators: instruction set simulator, cache, network-on-chip (NoC), DRAM, disk, Full-system: simulate an entire computer that complete software stacks from real systems can run without any modification a virtual hardware, e.g. QEMU, Gem5 Detail: functional vs. timing Timing simulators: cycle accurate, cycle-count accurate Input: trace-driven vs. execution-driven Tradeoffs between simulation speed and accuracy 21 National Tsing Hua University
QEMU A processor emulator using dynamic binary translation Full system emulation User mode emulation 22 National Tsing Hua University
QEMU Helper functions Inserted during binary translation (guest code -> TCG IR) to handle extra works, e.g. profiling 23 National Tsing Hua University
Outline of Performance Evaluation What do you mean by performance ? Performance metrics What to evaluate? Workloads, benchmarks How to evaluate? How to summarize and report? 24 National Tsing Hua University
Run and Reporting Rules Goal #1: reproducible results Document everything Others should be able to reproduce your results Goal #2: fair results Restrict tricks that can be played, e.g. optimizations must work for more than just this benchmark Specify how results may be summarized, e.g. use an appropriate averaging technique How to reduce n performance indices into a single number to produce a total ordering of computers? 25 National Tsing Hua University
Summarize Performance A straightforward idea: Sum individual benchmark times and then average Arithmetic Mean (Weighted Arithmetic Mean) = i n 1 1 1 n n = i or Time Weight Time i i i n 1 The problem: Benchmark Comp 1 A B Total Is Computer 3 really the fastest? Benchmark B dominates the performance! Comp 2 Comp 3 20 20 40 1 1000 1001 10 100 110 26 National Tsing Hua University
Summarize Performance with Ratios Arithmetic mean of ratios: (Ri)/n Normalized with respect to Computer 3: Benchmark Comp 1 A 1 (0.05) 10 (0.5) B 1000 (50) 100 (5) 20 (1) Mean 25.025 2.75 Computer 3 is the fastest! But, if normalized with respect to Computer 1: Benchmark Comp 1 A 1 (1) 10 (10) B 1000 (1) 100 (0.1) 20 (0.02) Mean 1 5.05 10.01 Computer 1 is the fastest! 3 is the slowest! Comp 2 Comp 3 20 (1) 1 Comp 2 Comp 3 20 (20) 27 National Tsing Hua University
Geometric Mean for Ratios 1 Geometric mean: n n 1 T T n = i = i = exp log i i T n T 1 1 ri ri Independent of the reference machine Benchmark Comp 1 A 1 (0.05) 10 (0.5) B 1000 (50) 100 (5) 20 (1) Mean wrt 3 1.58 1.58 Computer 3 is the fastest! Benchmark Comp 1 A 1 (1) 10 (10) B 1000 (1) 100 (0.1) 20 (0.02) Mean wrt 1 1 1 0.63 Computer 3 is the fastest! Comp 2 Comp 3 20 (1) 1 Comp 2 Comp 3 20 (20) 28 National Tsing Hua University
Geometric Mean for Ratios Geometric mean is not consistent with time: Benchmark Comp 1 A 12 B 16 Total time 28 Normalize to 1 1.00 G. mean wrt 1 1.00 Comp 2 Comp 3 6 32 38 1.36 1.00 24 8 32 1.14 1.00 So, what can we say about summarizing performance? 29 National Tsing Hua University
Geometric Mean for Ratios If benchmark execution times are normalized to some reference machine, and means of normalized execution times are computed, only the geometric mean gives consistent results no matter what the reference machine is. This has led to declaring the geometric mean as the preferred method of summarizing execution time (e.g., SPEC2006) 30 National Tsing Hua University
Summarizing Performance Time is the ultimate measure of performance (Weighted) arithmetic mean tracks time: But may be skewed by individual programs Is meaningless with normalized numbers Geometric mean: Consistent regardless of reference Independent of execution times of individual programs Does not predict execution time Best strategy: show the summarized number as well as numbers of individuals 31 National Tsing Hua University
Performance Evaluation: Summary Performance evaluation affects and guides the design of computers Good performance evaluation requires: Good benchmarks Good ways to summarize performance Execution time is the ultimate measure of computer performance! 32 National Tsing Hua University
Outline Measuring, reporting, summarizing performance (Sec. 1.8) Quantitative principles of computer design (Sec. 1.9) Take advantage of parallelism: e.g. multiple processors, disks, memory banks, pipelining, multiple functional units Principle of locality: Reuse of data and instructions Focus on the common case Amdahl s Law 33 National Tsing Hua University
1) Taking Advantage of Parallelism Increasing throughput of server computer via ILP, multiple cores/processors or multiple disks Examples of detailed HW designs Carry lookahead adders uses parallelism to speed up from linear to logarithmic in number of bits per operand Multiple memory banks searched in parallel in set- associative caches Pipelining: overlap instruction execution to reduce the total time to complete an instruction sequence. Not every instruction depends on immediate predecessor executing instructions completely/partially in parallel Superscalar, multithreading 34 National Tsing Hua University
2) Principle of Locality Programs access a relatively small portion of the address space at any instant of time 90/10 rule: a program spends 90% of its execution time in only 10% of the code Two different types of locality: Temporal locality (locality in time): If an item is referenced, it tends to be referenced again soon (e.g., loops, reuse) Spatial locality (locality in space): If an item is referenced, items whose addresses are close by tend to be referenced soon (e.g., straight-line code, array access) Last 30 years, HW relied on locality for memory performance 35 National Tsing Hua University
3) Focus on the Common Case Common sense guides computer design Since its engineering, common sense is valuable In making a design tradeoff, favor the frequent case over the infrequent case e.g., Instruction fetch and decode unit used more frequently than multiplier, so optimize it first Frequent case is often simpler and can be done faster than the infrequent case e.g., overflow is rare when adding 2 numbers, so improve performance by optimizing no-overflow What is frequent case and how much performance improved by making case faster Amdahl s Law 36 National Tsing Hua University
Amdahls Law (Law of Diminishing Returns) Speedup due to enhancement E: = Perfnew / Perfold = Told / Tnew = 1 f ) f + 1 ( P Performance improvement from using enhancement E is limited by the fraction that E can be applied The best that one can hope is 1/(1-f) Told f (1 - f) Tnew (1 - f) f/P 37 National Tsing Hua University
Amdahls Law Analogy Driving from NTHU in Hsinchu to NCKU in Tainan Driving at 110 km/hr using Highway 3 to ChangHua and then Highway 1 to Tainan 2 hr Driving at Hsinchu local (10 min.), Tainan local (20 min.) What is speedup using high-speed rail? High-speed rail at 230 km/hr: 1.1 hr (Speedup = 2/1.1 = 1.82) Including local driving: Total Speedup = 2.5 hr / 1.6 hr = 1.56 The efforts to resolve a bottleneck will lead to new bottlenecks in other parts Key is to speed up the frequently executed blocks 38 38 National Tsing Hua University
Maximum Speedup f = 0.9, s Speedup=10 G.M. Amdahl, Computer Architecture and Amdahl s Law, Computer, Dec. 2013. 39 National Tsing Hua University
Recap Performance evaluation Performance metrics Performance benchmarking Performance summary Computer design principles Take advantage of parallelism Principle of locality Focus on the common case 40 National Tsing Hua University


")
")


 Taking Advantage of Parallelism")
 Principle of Locality")
 Focus on the Common Case")
")