Spatial Data Analysis in R: County Mapping and Operations Overview
"Explore the world of spatial data analysis in R with a focus on county mapping and key operations. Learn how to work with spatial data, merge datasets, visualize maps, and perform basic spatial operations. Dive into examples and resources to enhance your spatial analysis skills."

Download Presentation

Please find below an Image/Link to download the presentation.
The content on the website is provided AS IS for your information and personal use only. It may not be sold, licensed, or shared on other websites without obtaining consent from the author. If you encounter any issues during the download, it is possible that the publisher has removed the file from their server.
You are allowed to download the files provided on this website for personal or commercial use, subject to the condition that they are used lawfully. All files are the property of their respective owners.
The content on the website is provided AS IS for your information and personal use only. It may not be sold, licensed, or shared on other websites without obtaining consent from the author.
E N D
Presentation Transcript
Maps 2 EPID 799C Fall 2017 To code along today: Have a county dataframe with FIPS Download Install packages galore: sp, rgdal, rgeos, tmap,
Today: Maps in R Quick Review Getting spatial data Read / write Merge Vis packages Data structures (sp/sf) Basic spatial operations Example map projects
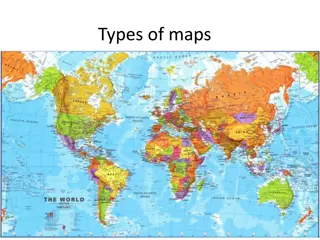
Review from last time Types: Point, Line, Poly, Raster Shapefile structure QGIS Basics
Getting spatial data Tiger Files: https://www.census.gov/geo/maps- data/data/tiger-line.html NC One Map http://data.nconemap.gov/geoportal/catalog/main /home.page Geocode your own
Read/write ReadOGR writeOGR
Merge Exactly the same as spatial! (Thanks, overloading) new_df = merge(df1, df2) # by= and all.x/all.y= parameters Important! 1. Do not merge the data by itself. I have done this. 2. Also: joining data can be a pain
Viz Packages base::plot() sp::spplot() ggplot tmap
Side note: There s a new structure in town! Simple features (sf) spec just a dataframe! The spatial information is stored as another variable Not quite as efficient in some ways, but easier to work with. Can eventually overload dplyr functions. See cran page and many vignettes
Basic Spatial Operations spTransform() gCentroid() gRelates() gTouches() ^simple version of above aggregate() (spatial) gBuffer() over() and %over% workhorse. (SE example here) gDist() spSample and many more http://www.epsg.org/ , cheat sheet, spatial reference list DE-9IM matrix
Lets Try! Prepare your county tbl
Map Project Examples Title VI complaint Flood plain mapping Alcohol exposure index Linking police killing Police traffic stops / police


![❤Book⚡[PDF]✔ Star Maps: History, Artistry, and Cartography (Springer Praxis Book](/thumb/21625/book-pdf-star-maps-history-artistry-and-cartography-springer-praxis-book.jpg)