Explore the application of Spatial Techniques, specifically Nearest Neighbour Analysis in Quantitative Geography as studied in D.D.U. Gorakhpur University. Understand settlement patterns, randomness indices, and dispersion calculations in geographical research.
Please find below an Image/Link to download the presentation.
The content on the website is provided AS IS for your information and personal use only. It may not be sold, licensed, or shared on other websites without obtaining consent from the author. If you encounter any issues during the download, it is possible that the publisher has removed the file from their server.
You are allowed to download the files provided on this website for personal or commercial use, subject to the condition that they are used lawfully. All files are the property of their respective owners.
The content on the website is provided AS IS for your information and personal use only. It may not be sold, licensed, or shared on other websites without obtaining consent from the author.
E N D
Presentation Transcript
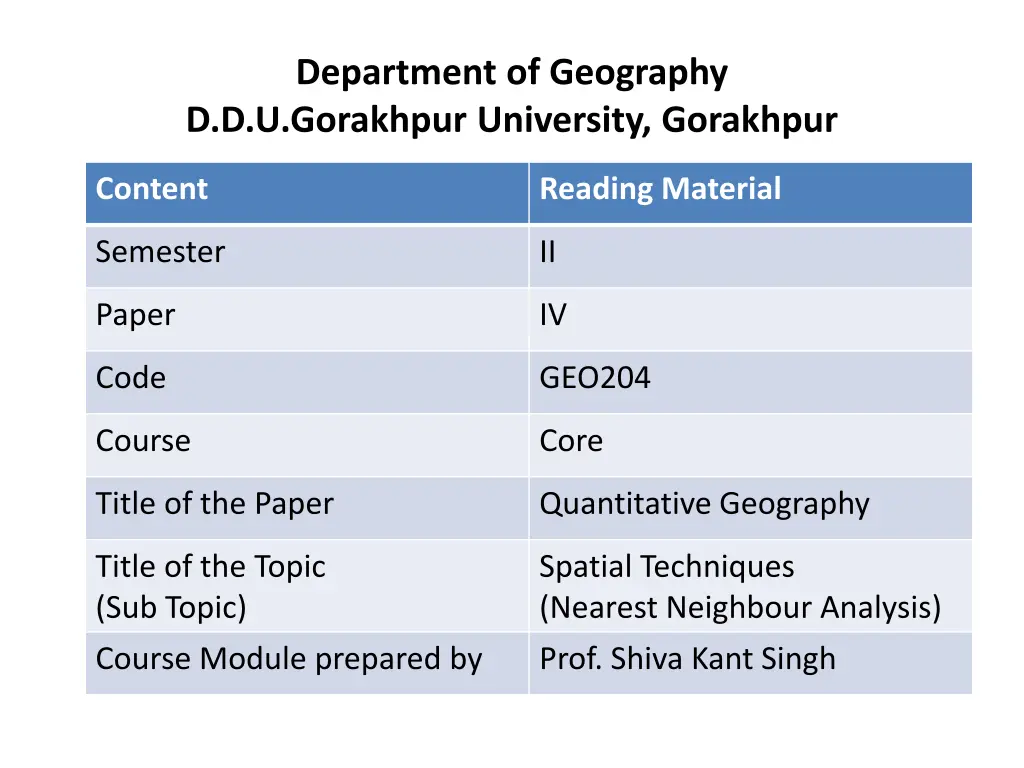
Department of Geography D.D.U.Gorakhpur University, Gorakhpur Content Reading Material Semester II Paper IV Code GEO204 Course Core Title of the Paper Quantitative Geography Title of the Topic (Sub Topic) Course Module prepared by Spatial Techniques (Nearest Neighbour Analysis) Prof. Shiva Kant Singh
fudVre iM+kslh fcUnq foysk.k (Nearest Neighbour Analysis) fofHkUu HkkSxksfyd rF;ksa dk HkwoSU;kfld rU= fcUnqor jgrk gSA /kjkry ij bu fcUnqor rF;ksa dk forj.k izfr:i dqN fuf pr eksa dks Li V djrk gS] tSls lewghdj.k] fc[kjk vkfn e mHkjrs gSaA fudVre iM+kslh fcUnq fo ys k.k ls forj.k ds fofHkUu izfr:iksa dk Li Vhdj.k gksrk gSA fudVre iM+kslh fcUnq fo ys k.k ls forj.k ds Uniform, Random and Clustered izfr:iksa dk irk pyrk gSA ewy:i esa bldk iz;ksx loZizFke Clark & Evans us fd;k FkkA ckn esa King & Dacey us Hkwxksy esa O;kid :i ls bldk iz;ksx fd;k] rHkh ls ;g fcUnqor forj.k izfr:i dks O;Dr djus gsrq iz;ksx fd;k tkus yxkA blds fy, vfu;ferrk lwpdkad (Index of Randomness or RN) Kkr fd;k tkrk gSA ,d mnkgj.k ls bls le>k;k x;k gS &
Settlements A B F C D a G E H 1 Cm. = 0.5 Km or 2 Cm. = 1 Km. R.F. 1:50000
fudVre iM+kslh fcUnq foysk.k ds ifjdyu ds pj.k ,d rkfydk cuk;sa ftlesa & igys dkye esa vf/kok;ksa dk e fy[kuk gS nwljs dkye esa fn;s x;s vf/koklksa dk e k% fudVre vf/kokl fy[kuk gSA rhljs dkye esa Ekkufp= ij mu fudVre vf/koklksa dh lM+d ekxZ ls nwjh lseh0 esa fy[kuk gSA pkSFks dkye esa ekufp= ds ekid ds vuqlkj nwjh dks fdyksehVj esa fy[kuk gSA tks rkfydk ds :i esa bl izdkj gS &
Calculation Table for NNA CALCULATION Area (12 x 0.5) x (10 x 0.5) = 30 Sq. Km. RN = Where RN = Index of Randomness dO = Observed Nearest Neighbour Distance dE = Expected Distance in a Random pattern Name of Settlement Nearest Neighbour Settlement Distance in Cm. Distance in Km. A F 3 1.5 dO dE B C 3 1.5 -------- C D 1.5 0.75 D C 1.5 0.75 E D 2 1.0 F A 5 2.5 G H 4 2.0 H G 4 2.0 dO = d/N dE = ------------- 2 N/A No. of Settlements 8 uksV & rkfydk esa nwfj;k vuqekfur gSa vkidks ekufp= ds vuqlkj ekiu dj fy[kuk gS Total Distance 12 Km. 1
dO = = = d/N 12/8 1.5 1 1 1 1 dE = --------- 2 N/A 1 = ---------- 2 8/30 = ---------- 2 0.27 = ---------- 2 x 0.52 = -------- 1.04 = 0.96 dO dE = ---------- 1.5 0.96 RN = --------- = 1.56 Answer : The area of settlement is more Dispersed than Random. vf/kokl dk {ks= ;kn`fPNd dh vis{kk vf/kd Qsyk gqvk gS
Ratio or NNI If RN value is - 0 = = Clustered iw.kZr% xzafFkr More Clusture than Random vfu;fer dh vis{kk vf/kd xzafFkr As Clusture as Random xzafFkr o vfu;fer :i esa More Random than Clusture xzafFkr dh vis{kk vf/kd vfu;fer Random iw.kZr% vfu;fer ;k ;kn`fPNd More Random than Disperse QSyko dh vis{kk vf/kd ;kn`fPNd As Random as Disperse vfu;fer o fc[kjs :i esa More Disperse than Random vfu;fer dh vis{kk vf/kd fc[kjh Dispersed iw.kZr% fc[kjk gqvk As Disperse as Uniform fc[kjk o lenwjLFk Uniform iw.kZr% lenwjLFk 0.5 = 1.0 = 1.5 = 2.0 = 2.491 = = = = = Thanks