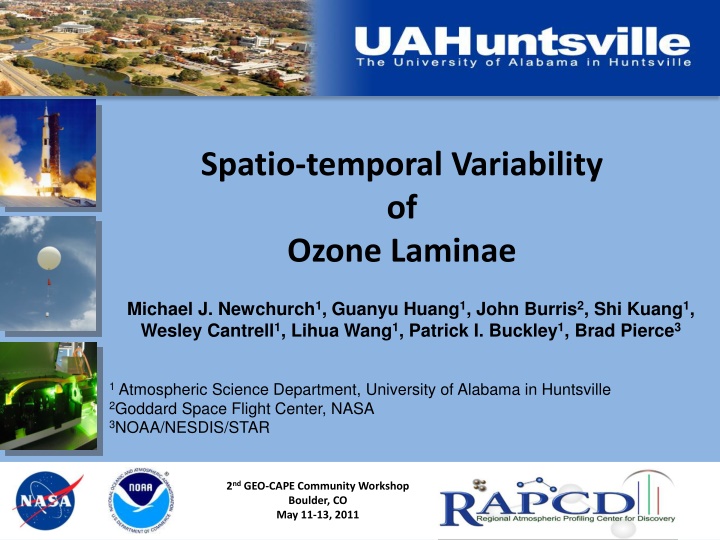
Spatio-temporal Variability of Ozone Laminae in Huntsville
Investigating the spatio-temporal variability of ozone laminae in Huntsville, this study by Michael Newchurch and team explores the atmospheric science aspects related to ozone dynamics. The research, presented at the GEO-CAPE Community Workshop in Boulder, delves into the implications of ozone layer variations, shedding light on ozone layer behavior and related environmental impacts.

Download Presentation

Please find below an Image/Link to download the presentation.
The content on the website is provided AS IS for your information and personal use only. It may not be sold, licensed, or shared on other websites without obtaining consent from the author.If you encounter any issues during the download, it is possible that the publisher has removed the file from their server.
You are allowed to download the files provided on this website for personal or commercial use, subject to the condition that they are used lawfully. All files are the property of their respective owners.
The content on the website is provided AS IS for your information and personal use only. It may not be sold, licensed, or shared on other websites without obtaining consent from the author.
E N D
Presentation Transcript
Spatio-temporal Variability of Ozone Laminae Michael J. Newchurch1, Guanyu Huang1, John Burris2, Shi Kuang1, Wesley Cantrell1, Lihua Wang1, Patrick I. Buckley1, Brad Pierce3 1 Atmospheric Science Department, University of Alabama in Huntsville 2Goddard Space Flight Center, NASA 3NOAA/NESDIS/STAR 2nd GEO-CAPE Community Workshop Boulder, CO May 11-13, 2011
Outline 1. Vertical information from space-borne observations. 2. Sondes and lidars and laminar structures 3. Vertical correlation of ozone 4. STE of ozone 5. Birmingham ozone/aerosol nocturnal-jet plume 6. Modeling of laminar structures 7. Ozone lidar network
High-resolution PBL lidar observation suggests both UV and Vis radiances required to capture significant PBL signal for satellite Huntsville lidar observation on Aug. 4, 2010 Lidar obs. convolved with OMI UV averaging kernel---- unable to capture the highly variable ozone structure in PBL Lidar obs. Convolved with OMI UV-Vis averaging kernel- ---Captures the PBL ozone structure. X. Liu et al.
Theoretical retrievals from multi-spectral measurements Courtesy of Natraj, Liu, et al. True A priori UV retrieval Vis retrieval TIR retrieval UV + Vis UV + TIR UV + Vis + TIR
J O U R N A L O F A P P L I E D M E T E O R O L O G Y VOLUME 38 The Role of Vertical Mixing in the Temporal Evolution of Ground-Level Ozone Concentrations JIAN ZHANG AND S. TRIVIKRAMA RAO Department of Earth and Atmospheric Sciences, University at Albany, State University of New York, Albany, New York (Manuscript received 15 July 1998, in final form 19 February 1999) The results reveal that a greater reduction in the ground-level ozone concentration can be achieved by decreasing the concentrations of ozone and precursors aloft than can be achieved from a reduction of local emissions
Typical, large diurnal variability in the Boundary Layer Zhang and Rao, 1999
Continuous Wavelet Transform (CWT) The CWT coefficient is defined as: 1 ) , ( a z b z = t ( ) ( ) W a b f z dz f a z b a is the spatial extent or dilation of the function. b is the location at which the wavelet function is centered the translation of the function. f(z) is the signal of interest, in this case, an ozone profile. and are the top and the bottom of the profile. is the wavelet function. ) (z t Z Z b
Laminar structure analyzed by CWT and the gradient method
Seasonal Variations Occur in Altitudinal Distributions- Layer Height WRT to Tropopause Height Gradient Wavelet Spring Low frequency of layers near tropopause Summer High frequency of layers below tropopause Trinidad Head 9
Fine structure in the temporal variations of layer attributes can be quantified by Wavelet and Gradient methods from Lidar observations. Layer A Max-Min Max: 50.1 ppbv Min: 36.6 ppbv Mean max-min : 2.5 ppbv / 10min +7.9 ppbv / 10min -2.4 ppbv / 10min Temporal variability from other layer attributes can be similarly quantified. A For example: O3 peak altitude, mixing ratio at peak. B Layer B Thickness Max: 4.8 km Min: 3.0 km Mean Thickness: 0.3 km /10min +0.9 km /10min -0.3 km /10min 10 10 10
Ozone in the free troposphere is not correlated with surface ozone Seasonal correlation of surface w/ ozone aloft Huntsville 1999-2010 Ozonesonde Data P(R^2>0.5)= 10% 12% 15% 19%
Laminar structures cause anomalous behavior in correlations Huntsville Lidar Data EPA Surface Data
Horizontal Variability Surface ozone of 24 sonde profiles compared with local EPA site: The variance in the surface ozone amounts at the ozonesonde/lidar site seen in the EPA HSV-Airport Rd. site (~10 km distant; Summer 2010) is about 75%. The other 25% is the HORIZONTAL variance. UAHuntsville Campus Ozone Measured with ozonesonde 1/28/2011 June 19 Inside 18-25 25-30 30-35 ppbv Percent difference reaches ~30% for measurements away from buildings.
Apr. 17 Apr. 23 What We Missed with the Weekly Ozonesonde Measurements? May 1 Apr. 27 Additional sonding on Tue. after the lidar detection of Stratosphere-troposphere exchange (STE) Dry air 14
Tropospheric ozone variability due to STE captured by the HSV lidar O3 lidar retrieval 500ppbv 10min resolution Cloud Cloud Cloud sonde
Different variation structures for ozone and aerosol suggest local photochemistry dominates the production Ozone mixing ratio, August 4, 2010 O3 diurnal variation Aerosol ext. coeff. at 291nm from O3 DIAL The rapid aerosol variation in the PBL suggests the importance of a collocated aerosol measurement. 16
Nocturnal ozone enhancement associated with low-level jet Lidar Oct. 4, 2008 Co-located wind profiler Low-level jet Aerosol ext.coeff. at 291nm from O3 lidar (a) Positive correlation of ozone and aerosol due to transport Co-located ceilometer backscatter Kuang et al. submitted to Atmospheric Environment Aerosol 17
RAQMS misses ozone layer at 2-4km May 3, 2010 over estimates depth of 6-8km layer Daytime PBL top collapsed shows collapse of PBL May 01 May 02 May 03 May 04 May 05 May 06 May 07 May 08
May 6 (high PBL O3) RAQMS is in good agreement with Huntsville Lidar above ~3km under estimates low level ozone enhancement May 01 May 02 May 03 May 04 May 05 May 06 May 07 May 08 Saharan dust event O3 AQ event
May 7 RAQMS shows diffuse free Tropospheric ozone Does not resolve thin filaments observed By lidar May 01 May 02 May 03 May 04 May 05 May 06 May 07 May 08 Saharan dust event O3 AQ event
Ozone Lidar Network 1. Technology developed to produce a/c instruments (Browell/NASA, Hardesty/NOAA) and ground-based (McDermid/NASA/TMF, Newchurch/UAH&NASA). A few other ozone lidars operate in Europe and Asia. NASA has formed a working group to identify a pathway in science and technology to eventually create a network of ground-based ozone lidars. Such an ozone lidar network would be very complementary to the NASA GEO-CAPE geostationary AQ/Ocean satellite planned for ~2020. 2. 3.
4-hour temporal resolution vs. 10-minute resolution $800/ ozonesonde launch No more than 6 launch per 24 hours = 4-hour resolution $800/launch*6launch/day*365days/year=$1,752,000/year Vs. Lidar 10-minute observations sonde
Conclusions 1. Ozonesonde and lidar observations identify ubiquitous laminar structures. 2. Laminar transport from STE and NBL transport can be important for AQ. 3. Current regional models often do not resolve laminar structures of importance to surface AQ. 4. An ozone lidar network is a potential solution to acquire the vertical ozone information needed by AQ practitioners.
Correlation Lengths Definition: the altitude over which R^2 decreases from 1 to 0.5. Each line is a regression through the correlations of at least 0.5. Correlations >0.5 above the first occurrence of a statistically insignificant value (<0.5) are not considered. Two clusters Conclusion: Measurements of ozone above correlation length carries no info about surface ozone. Corollary: To determine surface ozone concentration, a measurement must contain info from within the correlation length.


")


")