Spearman's Rank Correlation Coefficient in Data Analysis
Learn about Spearman's rank correlation coefficient, its application, and how it differs from Pearson's correlation coefficient. Explore how to interpret rank correlation coefficients for non-linear data trends.
Download Presentation

Please find below an Image/Link to download the presentation.
The content on the website is provided AS IS for your information and personal use only. It may not be sold, licensed, or shared on other websites without obtaining consent from the author. If you encounter any issues during the download, it is possible that the publisher has removed the file from their server.
You are allowed to download the files provided on this website for personal or commercial use, subject to the condition that they are used lawfully. All files are the property of their respective owners.
The content on the website is provided AS IS for your information and personal use only. It may not be sold, licensed, or shared on other websites without obtaining consent from the author.
E N D
Presentation Transcript
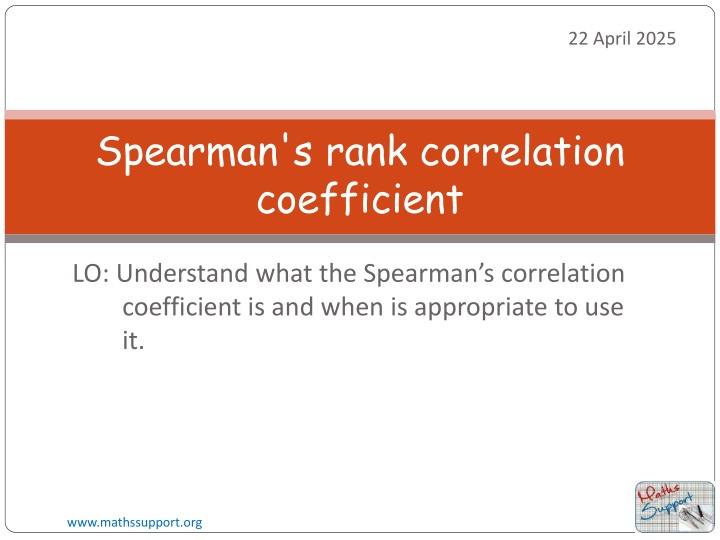
22 April 2025 Spearman's rank correlation coefficient LO: Understand what the Spearman s correlation coefficient is and when is appropriate to use it. www.mathssupport.org www.mathssupport.org
The table shows data from 10 athletes competing in a track and field competition. It includes the length of their longest jump, and the maximum speed they reached on their approach 8.68 8.92 8.57 8.47 8.96 8.84 8.72 7.46 7.28 8.08 Maximum speed (x) ms-1 4.64 5.29 4.38 4.31 5.22 4.62 4.58 3.94 3.89 4.28 Longest jump (y) m The scatter diagram of the data is the following 6 Use the GDC to calculate Pearson s correlation coefficient (r). 5 r 0.864 Longest jump (y) m This coefficient suggests a strong (but not perfect) positive correlation between the variables In cases like this we may not be convinced that a linear model is appropriate for the data We may therefore wish to focus on the trend of the data, either upward or downward 4 3 2 8 8.5 7.5 9 7 Maximum speed (x) ms-1 www.mathssupport.org
One way to do this is to consider the relationship between each variables ranks instead of the raw values 8.68 6 8.92 9 8.57 5 8.47 4 8.96 10 8.84 8 8.72 7 7.46 2 7.28 1 8.08 3 Maximum speed (x) ms-1 Rank of x Longest jump (y) m 4.64 8 5.29 10 4.38 5 4.31 4 5.22 9 4.62 7 4.58 6 3.94 2 3.89 1 4.28 3 Rank of y For this example we can assign each x-value a rank and each y-value a rank 10 9 8 A rank of 1 corresponds to the smallest value, rank 2 corresponds to the second smallest, and so on Now we plot the scatter diagram of the ranked data. Use the GDC to calculate Pearson s correlation coefficient (r). r 0.952 7 6 Rank of y 5 4 3 2 1 This indicates a strong upward but no necessarily linear trend in the original data 11 1 2 3 4 5 6 7 8 9 10 Rank of x www.mathssupport.org
Spearmans rank correlation coefficient Spearman s rank correlation coefficient A Spearman s rank correlation coefficientof a bivariate data set is defined as the Pearson s product moment correlation coefficient of the variables ranks. To distinguish between the two correlation coefficients, its is common to use rp for Pearson s product-moment correlation coefficient rs for Spearman s rank correlation coefficient Since Spearman s rank correlation coefficient only considers the relationship between the ranks and not the data itself, rs is often used instead of rp when the data is clearly non-linear, but has upward or downward trend www.mathssupport.org www.mathssupport.org
Spearmans rank correlation coefficient Spearman s rank correlation coefficient An rs value of 1 means that the set of data is strictly increasing. An rs value of -1 means that the set of data is strictly decreasing. Data that is only increasing or only decreasing is known as monotonic A value close to 0 suggests that the data is not consistently increasing or decreasing www.mathssupport.org www.mathssupport.org
The population of black bears on a particular island has been recorded every 5 years since 1978: 0 5 10 15 20 25 30 35 40 45 Years since 1978 (t) 1030 1836 2678 3077 3394 3501 3479 3418 3511 3528 Population (P) (a) Draw the scatter diagram for the data. (b) Calculate Pearson s product-moment correlation rp coefficient for this data. (c) Find the ranks for each variable and draw a scatter diagram of the ranks. (d) Calculate Spearman s rank correlation coefficient, rs. (e) Which correlation coefficient is more appropriate to use for this data? Explain your answer. (f) Describe the correlation between the variables. www.mathssupport.org
The population of black bears on a particular island has been recorded every 5 years since 1978: 0 5 10 15 20 25 30 35 40 45 Years since 1978 (t) 1030 1836 2678 3077 3394 3501 3479 3418 3511 3528 Population (P) (a) Draw the scatter diagram for the data. 4000 3500 3000 Population (P) 2500 2000 1500 1000 500 5 10 15 20 25 30 35 40 45 Years since 1978 (t) www.mathssupport.org
The population of black bears on a particular island has been recorded every 5 years since 1978: 0 5 10 15 20 25 30 35 40 45 Years since 1978 (t) 1030 1836 2678 3077 3394 3501 3479 3418 3511 3528 Population (P) (b) Calculate Pearson s product-moment correlation rp coefficient for this data. Use the GDC to calculate Pearson s correlation coefficient (r). 4000 3500 3000 Population (P) rp 0.836 2500 2000 1500 1000 500 5 10 15 20 25 30 35 40 45 Years since 1978 (t) www.mathssupport.org
The population of black bears on a particular island has been recorded every 5 years since 1978: 0 1 5 2 10 3 15 4 20 5 25 6 30 7 35 8 40 9 45 10 Years since 1978 (t) Rank of t Population (P) 1030 1 1836 2 2678 3 3077 4 3394 5 3501 8 3479 7 3418 6 3511 9 3528 10 Rank of P (c) Find the ranks for each variable and draw a scatter diagram of the ranks. 10 9 8 7 6 Rank of P Now we plot the scatter diagram of the ranked data. 5 4 3 2 1 11 1 2 3 4 5 6 7 8 9 10 Rank of t www.mathssupport.org
The population of black bears on a particular island has been recorded every 5 years since 1978: 0 1 5 2 10 3 15 4 20 5 25 6 30 7 35 8 40 9 45 10 Years since 1978 (t) Rank of t Population (P) 1030 1 1836 2 2678 3 3077 4 3394 5 3501 8 3479 7 3418 6 3511 9 3528 10 Rank of P 10 (d) Calculate Spearman s rank correlation coefficient, rs. 9 8 7 Use the GDC to calculate Spearman s rank correlation coefficient, rs. 6 Rank of P 5 4 rs 0.952 3 2 1 11 1 2 3 4 5 6 7 8 9 10 Rank of t www.mathssupport.org
The population of black bears on a particular island has been recorded every 5 years since 1978: 0 1 5 2 10 3 15 4 20 5 25 6 30 7 35 8 40 9 45 10 Years since 1978 (t) Rank of t Population (P) 1030 1 1836 2 2678 3 3077 4 3394 5 3501 8 3479 7 3418 6 3511 9 3528 10 Rank of P 10 (e) Which correlation coefficient is more appropriate to use for this data? Explain your answer. 9 8 7 6 Rank of P Looking at the scatter graph of the raw data, the relationship between the variables is clearly non-linear. Spearman s rank correlation coefficient is therefore more appropriate. 5 4 3 2 1 11 1 2 3 4 5 6 7 8 9 10 Rank of t www.mathssupport.org
The population of black bears on a particular island has been recorded every 5 years since 1978: 0 1 5 2 10 3 15 4 20 5 25 6 30 7 35 8 40 9 45 10 Years since 1978 (t) Rank of t Population (P) 1030 1 1836 2 2678 3 3077 4 3394 5 3501 8 3479 7 3418 6 3511 9 3528 10 Rank of P 10 (f) Describe the correlation between the variables. 9 8 7 Based on the value of rs, there is a strong positive non-linear correlation between the variables. 6 Rank of P 5 4 3 2 1 11 1 2 3 4 5 6 7 8 9 10 Rank of t www.mathssupport.org
Ranks of tied values The time spent training by 6 athletes and their time to run 2 km has been recorded 23 34 17 23 29 45 Time spent training (t) hours 12 10 14 11 11 8 Time to run 2 km (r), minutes Calculate Spearman s rank correlation coefficient, rs. 2.5 5 1 2.5 4 6 Rank of t 5 2 6 3.5 3.5 1 Rank of r When more than one piece of data have the same value the rank given to each is the average of the ranks. Use the GDC to calculate Spearman s rank correlation coefficient, rs. rs - 0.956 www.mathssupport.org
Thank you for using resources from A close up of a cage Description automatically generated For more resources visit our website https://www.mathssupport.org If you have a special request, drop us an email info@mathssupport.org www.mathssupport.org


