Spectrophotometry of Food Coloring Solutions
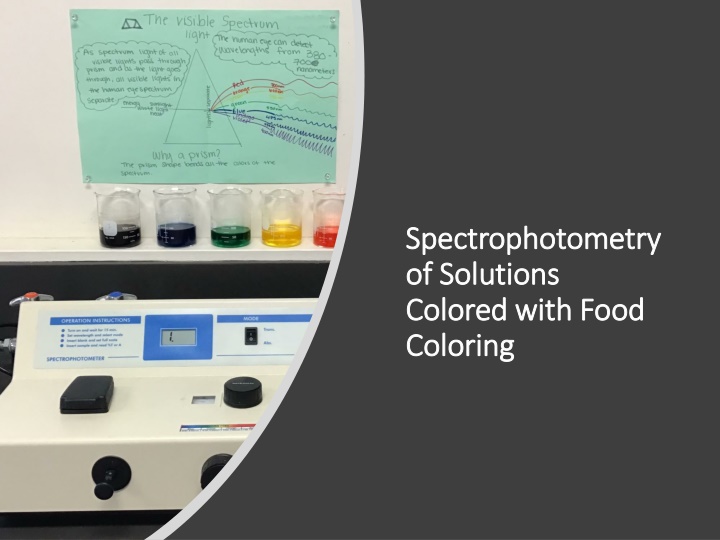
Analyzing the absorbance spectrum of various colored solutions using spectrophotometry reveals the dilution series and absorbance values. Different colors like red, orange, yellow, green, blue, and purple are evaluated at specific wavelengths, providing insights into the concentration changes as the solutions are diluted.

Download Presentation

Please find below an Image/Link to download the presentation.
The content on the website is provided AS IS for your information and personal use only. It may not be sold, licensed, or shared on other websites without obtaining consent from the author.If you encounter any issues during the download, it is possible that the publisher has removed the file from their server.
You are allowed to download the files provided on this website for personal or commercial use, subject to the condition that they are used lawfully. All files are the property of their respective owners.
The content on the website is provided AS IS for your information and personal use only. It may not be sold, licensed, or shared on other websites without obtaining consent from the author.
E N D
Presentation Transcript
Spectrophotometry Spectrophotometry of Solutions of Solutions Colored with Food Colored with Food Coloring Coloring
Absorbance spectrum of food coloring in solution (2 drops / 150 mL) 2 Red, Orange, and Yellow solutions were diluted and evaluated at 450 nm. 1.8 1.6 1.4 Green, Blue, and Purple solutions were diluted and evaluated at 625 nm. 1.2 Absorbance 1 0.8 0.6 0.4 0.2 0 400 425 450 475 500 525 550 575 600 625 650 675 700 725 750 775 800 825 850 875 900 925 950 975 1000 Wavelength (nm) Solution Color Purple Solution Color Blue Solution Color Green Solution Color Yellow Solution Color Orange Solution Color Red
Food Coloring Food Coloring Solutions Solutions Dilution Dilution Series Series
Absorbance Values of Diluted Absorbance Values of Diluted Color Samples Color Samples OD625nm OD450nm Sample Dilution 1:1 1:2 1:4 1:8 1:16 1:32 1:64 Note: Sample Dilution = part color solution : total number of parts Purple 0.89 0.46 0.22 0.12 0.05 0.04 0.00 Blue 1.75 0.93 0.44 0.22 0.10 0.06 0.03 Green 1.64 0.89 0.42 0.21 0.11 0.04 0.01 Yellow 2.10 1.08 0.48 0.26 0.11 0.05 0.01 Orange 1.46 0.69 0.32 0.20 0.06 0.03 0.01 Red 1.76 0.78 0.41 0.23 0.08 0.05 0.01