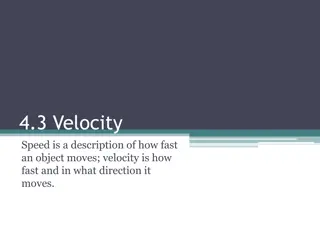
Speed of Racing Car Analysis
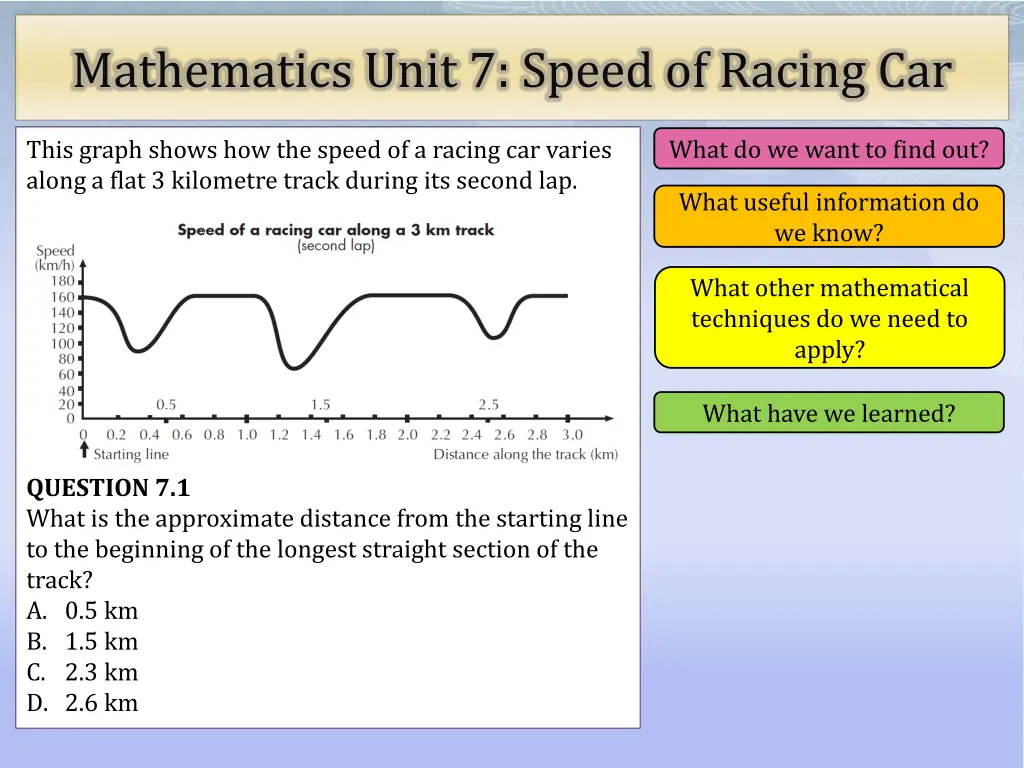
Explore the speed variation of a racing car along a 3-kilometre track during its second lap. Analyze the graph to determine the distance from the starting line to the beginning of the longest straight section of the track.

Download Presentation

Please find below an Image/Link to download the presentation.
The content on the website is provided AS IS for your information and personal use only. It may not be sold, licensed, or shared on other websites without obtaining consent from the author. If you encounter any issues during the download, it is possible that the publisher has removed the file from their server.
You are allowed to download the files provided on this website for personal or commercial use, subject to the condition that they are used lawfully. All files are the property of their respective owners.
The content on the website is provided AS IS for your information and personal use only. It may not be sold, licensed, or shared on other websites without obtaining consent from the author.
E N D
Presentation Transcript
Mathematics Unit 7: Speed of Racing Car What do we want to find out? What do we want to find out? This graph shows how the speed of a racing car varies along a flat 3 kilometre track during its second lap. What useful information do we know? What useful information do we know? What other mathematical techniques do we need to apply? What other mathematical techniques do we need to apply? What have we learned? What have we learned? QUESTION 7.1 What is the approximate distance from the starting line to the beginning of the longest straight section of the track? A. 0.5 km B. 1.5 km C. 2.3 km D. 2.6 km
Mathematics Unit 7: Speed of Racing Car What do we want to find out? What do we want to find out? This graph shows how the speed of a racing car varies along a flat 3 kilometre track during its second lap. What useful information do we know? What useful information do we know? What other mathematical techniques do we need to apply? What other mathematical techniques do we need to apply? What have we learned? What have we learned? QUESTION 7.1 What is the approximate distance from the starting line to the beginning of the longest straight section of the track? A. 0.5 km B. 1.5 km C. 2.3 km D. 2.6 km Back to start Back to start
Mathematics Unit 7: Speed of Racing Car What do we want to find out? What do we want to find out? This graph shows how the speed of a racing car varies along a flat 3 kilometre track during its second lap. What useful information do we know? What useful information do we know? What other mathematical techniques do we need to apply? What other mathematical techniques do we need to apply? What have we learned? What have we learned? QUESTION 7.1 What is the approximate distance from the starting line to the beginning of the longest straight section of the track? A. 0.5 km B. 1.5 km C. 2.3 km D. 2.6 km Back to start Back to start
Mathematics Unit 7: Speed of Racing Car What do we want to find out? What do we want to find out? This graph shows how the speed of a racing car varies along a flat 3 kilometre track during its second lap. What useful information do we know? What useful information do we know? What other mathematical techniques do we need to apply? What other mathematical techniques do we need to apply? What have we learned? What have we learned? QUESTION 7.1 What is the approximate distance from the starting line to the beginning of the longest straight section of the track? A. 0.5 km B. 1.5 km C. 2.3 km D. 2.6 km Back to start Back to start
Mathematics Unit 7: Speed of Racing Car What do we want to find out? What do we want to find out? This graph shows how the speed of a racing car varies along a flat 3 kilometre track during its second lap. What useful information do we know? What useful information do we know? What other mathematical techniques do we need to apply? What other mathematical techniques do we need to apply? What have we learned? What have we learned? QUESTION 7.1 What is the approximate distance from the starting line to the beginning of the longest straight section of the track? A. 0.5 km B. 1.5 km C. 2.3 km D. 2.6 km Back to start Back to start
Mathematics Unit 7: Speed of Racing Car What do we want to find out? What do we want to find out? This graph shows how the speed of a racing car varies along a flat 3 kilometre track during its second lap. What useful information do we know? What useful information do we know? What other mathematical techniques do we need to apply? What other mathematical techniques do we need to apply? What have we learned? What have we learned? QUESTION 7.2 Where was the lowest speed recorded during the second lap? A. At the starting line. B. At about 0.8 km. C. At about 1.3 km. D. Halfway around the track.
Mathematics Unit 7: Speed of Racing Car What do we want to find out? What do we want to find out? This graph shows how the speed of a racing car varies along a flat 3 kilometre track during its second lap. What useful information do we know? What useful information do we know? What other mathematical techniques do we need to apply? What other mathematical techniques do we need to apply? What have we learned? What have we learned? QUESTION 7.2 Where was the lowest speed recorded during the second lap? A. At the starting line. B. At about 0.8 km. C. At about 1.3 km. D. Halfway around the track. Back to start Back to start
Mathematics Unit 7: Speed of Racing Car What do we want to find out? What do we want to find out? This graph shows how the speed of a racing car varies along a flat 3 kilometre track during its second lap. What useful information do we know? What useful information do we know? What other mathematical techniques do we need to apply? What other mathematical techniques do we need to apply? What have we learned? What have we learned? QUESTION 7.2 Where was the lowest speed recorded during the second lap? A. At the starting line. B. At about 0.8 km. C. At about 1.3 km. D. Halfway around the track. Back to start Back to start
Mathematics Unit 7: Speed of Racing Car What do we want to find out? What do we want to find out? This graph shows how the speed of a racing car varies along a flat 3 kilometre track during its second lap. What useful information do we know? What useful information do we know? What other mathematical techniques do we need to apply? What other mathematical techniques do we need to apply? What have we learned? What have we learned? QUESTION 7.2 Where was the lowest speed recorded during the second lap? A. At the starting line. B. At about 0.8 km. C. At about 1.3 km. D. Halfway around the track. Back to start Back to start
Mathematics Unit 7: Speed of Racing Car What do we want to find out? What do we want to find out? This graph shows how the speed of a racing car varies along a flat 3 kilometre track during its second lap. What useful information do we know? What useful information do we know? What other mathematical techniques do we need to apply? What other mathematical techniques do we need to apply? What have we learned? What have we learned? QUESTION 7.2 Where was the lowest speed recorded during the second lap? A. At the starting line. B. At about 0.8 km. C. At about 1.3 km. D. Halfway around the track. Back to start Back to start
Mathematics Unit 7: Speed of Racing Car What do we want to find out? What do we want to find out? This graph shows how the speed of a racing car varies along a flat 3 kilometre track during its second lap. What useful information do we know? What useful information do we know? What other mathematical techniques do we need to apply? What other mathematical techniques do we need to apply? What have we learned? What have we learned? QUESTION 7.3 What can you say about the speed of the car between the 2.6 km and 2.8 km marks? A. The speed of the car remains constant. B. The speed of the car is increasing. C. The speed of the car is decreasing. D. The speed of the car cannot be determined from the graph.
Mathematics Unit 7: Speed of Racing Car What do we want to find out? What do we want to find out? This graph shows how the speed of a racing car varies along a flat 3 kilometre track during its second lap. What useful information do we know? What useful information do we know? What other mathematical techniques do we need to apply? What other mathematical techniques do we need to apply? What have we learned? What have we learned? QUESTION 7.3 What can you say about the speed of the car between the 2.6 km and 2.8 km marks? A. The speed of the car remains constant. B. The speed of the car is increasing. C. The speed of the car is decreasing. D. The speed of the car cannot be determined from the graph. Back to start Back to start
Mathematics Unit 7: Speed of Racing Car What do we want to find out? What do we want to find out? This graph shows how the speed of a racing car varies along a flat 3 kilometre track during its second lap. What useful information do we know? What useful information do we know? What other mathematical techniques do we need to apply? What other mathematical techniques do we need to apply? What have we learned? What have we learned? QUESTION 7.3 What can you say about the speed of the car between the 2.6 km and 2.8 km marks? A. The speed of the car remains constant. B. The speed of the car is increasing. C. The speed of the car is decreasing. D. The speed of the car cannot be determined from the graph. Back to start Back to start
Mathematics Unit 7: Speed of Racing Car What do we want to find out? What do we want to find out? This graph shows how the speed of a racing car varies along a flat 3 kilometre track during its second lap. What useful information do we know? What useful information do we know? What other mathematical techniques do we need to apply? What other mathematical techniques do we need to apply? What have we learned? What have we learned? QUESTION 7.3 What can you say about the speed of the car between the 2.6 km and 2.8 km marks? A. The speed of the car remains constant. B. The speed of the car is increasing. C. The speed of the car is decreasing. D. The speed of the car cannot be determined from the graph. Back to start Back to start
Mathematics Unit 7: Speed of Racing Car What do we want to find out? What do we want to find out? This graph shows how the speed of a racing car varies along a flat 3 kilometre track during its second lap. What useful information do we know? What useful information do we know? What other mathematical techniques do we need to apply? What other mathematical techniques do we need to apply? What have we learned? What have we learned? QUESTION 7.3 What can you say about the speed of the car between the 2.6 km and 2.8 km marks? A. The speed of the car remains constant. B. The speed of the car is increasing. C. The speed of the car is decreasing. D. The speed of the car cannot be determined from the graph. Back to start Back to start
Mathematics Unit 7: Speed of Racing Car What do we want to find out? What do we want to find out? This graph shows how the speed of a racing car varies along a flat 3 kilometre track during its second lap. What useful information do we know? What useful information do we know? What other mathematical techniques do we need to apply? What other mathematical techniques do we need to apply? QUESTION 7.4 Here are pictures of five tracks. Along which one of these tracks was the car driven to produce the speed graph shown above? What have we learned? What have we learned?
Mathematics Unit 7: Speed of Racing Car What do we want to find out? What do we want to find out? This graph shows how the speed of a racing car varies along a flat 3 kilometre track during its second lap. What useful information do we know? What useful information do we know? What other mathematical techniques do we need to apply? What other mathematical techniques do we need to apply? QUESTION 7.4 Here are pictures of five tracks. Along which one of these tracks was the car driven to produce the speed graph shown above? What have we learned? What have we learned? Back to start Back to start
Mathematics Unit 7: Speed of Racing Car What do we want to find out? What do we want to find out? This graph shows how the speed of a racing car varies along a flat 3 kilometre track during its second lap. What useful information do we know? What useful information do we know? What other mathematical techniques do we need to apply? What other mathematical techniques do we need to apply? QUESTION 7.4 Here are pictures of five tracks. Along which one of these tracks was the car driven to produce the speed graph shown above? What have we learned? What have we learned? Back to start Back to start
Mathematics Unit 7: Speed of Racing Car What do we want to find out? What do we want to find out? This graph shows how the speed of a racing car varies along a flat 3 kilometre track during its second lap. What useful information do we know? What useful information do we know? What other mathematical techniques do we need to apply? What other mathematical techniques do we need to apply? QUESTION 7.4 Here are pictures of five tracks. Along which one of these tracks was the car driven to produce the speed graph shown above? What have we learned? What have we learned? Back to start Back to start
Mathematics Unit 7: Speed of Racing Car What do we want to find out? What do we want to find out? This graph shows how the speed of a racing car varies along a flat 3 kilometre track during its second lap. What useful information do we know? What useful information do we know? What other mathematical techniques do we need to apply? What other mathematical techniques do we need to apply? QUESTION 7.4 Here are pictures of five tracks. Along which one of these tracks was the car driven to produce the speed graph shown above? What have we learned? What have we learned? Back to start Back to start