Sponsored Projects Office: Awards, Submissions, and Funding Insights
"Explore the growth in sponsored project funding over the years, submission trends, average award amounts, program-based awards, and funding sources at the HSC Sponsored Projects Office. Gain valuable insights from the data visualizations provided."

Download Presentation

Please find below an Image/Link to download the presentation.
The content on the website is provided AS IS for your information and personal use only. It may not be sold, licensed, or shared on other websites without obtaining consent from the author. If you encounter any issues during the download, it is possible that the publisher has removed the file from their server.
You are allowed to download the files provided on this website for personal or commercial use, subject to the condition that they are used lawfully. All files are the property of their respective owners.
The content on the website is provided AS IS for your information and personal use only. It may not be sold, licensed, or shared on other websites without obtaining consent from the author.
E N D
Presentation Transcript
HSC SPONSORED PROJECTS OFFICE / PREAWARD
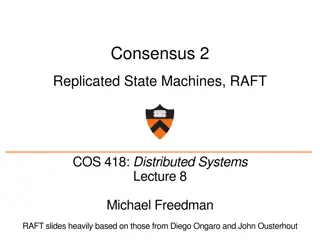
Award History Over the last couple of years, sponsored project funding has progressively increased. These award dollars are made up of various types of agreements and funding sources which will be shown further down. 3 YEAR AWARD HISTORY, FY12 FY14 YTD (1/29/14) $160 Millions $140 $120 $100 Awarded $'s $80 $60 $40 $20 $- FY12 FY13 FY14 YTD $71,523,71 Series1 $148,363,6 $149,737,9
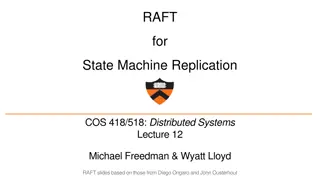
Submission History Submissions will fluctuate on a yearly basis. This can be attributed to increase/decrease in faculty, funding opportunities available at that time, specialized funding available (ARRA, ACA), and many more variables. We all work hard to ensure as many submissions as possible are funded. 3 YEAR SUBMISSION HISTORY, FY12 FY14 YTD (1/29/14) $300 Millions $250 $200 $150 $100 $50 $- FY12 FY13 FY14 YTD Series1 $255,382,25 $253,910,53 $129,723,59
NUMBER OF AWARDS/SUBMISSIONS Awards Submissions # of Awards History # of Submissions History 883 807 900 1316 1244 1400 800 1200 700 600 1000 406 615 500 800 400 600 300 400 200 200 100 0 0 FY12 FY13 FY14 YTD FY12 FY13 FY14 YTD
AVERAGE AWARD $S BY FISCAL YEAR $185,548 $190,000 $185,000 $176,166 $180,000 $175,000 $168,022 $170,000 $165,000 $160,000 $155,000 FY12 FY13 FY14 YTD
NUMBER OF AWARDS BY PROGRAM TYPE, FY12 - FY14 YTD (1-29-14) 450 400 350 300 250 FY12 FY13 FY14 YTD 200 150 100 50 0
Funding Source (Awards) The HSC receives the majority of its sponsored project funding from Federal Sources (such as NIH, HRSA). AWARDS BY FUNDING SOURCE FY12 FY14 YTD (1/29/14) Millions $100 We continue to see an increase in both Industry funding and Foundation funding. $80 Federal Agencies are inclusive of Federal Flow Throughs. $60 $40 $20 $- Federal Agencies State of New Mexico Industry Foundations Other FY12 FY13 FY14 YTD
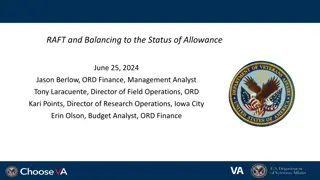
NIH Award History NIH is the prime funder for the HSC s Federal Sponsored Projects. The decline in award history is attributed to the sequester, faculty leaving the Institution, grants from FY12 entering a No-Cost Extension phase for FY13, and grant cycles ending. $70 Millions NIH AWARD HISTORY FY12 FY14 YTD (1- $60 $50 $40 $30 29-14) $20 $10 $- FY12 FY13 FY14 YTD $24,799,256 Series1 $63,208,412 $42,721,717
NUMBER OF AFFORDABLE CARE ACT (ACA) SUBMISSION HISTORY 29 27 30 25 17 20 15 10 5 0 FY12 FY13 FY14 YTD
INSTRUMENT TYPES AWARDED/SUBMITTED # of Submitted Projects # of Awarded Projects 450 600 FY12 FY12 400 FY13 FY13 500 350 FY14 YTD FY14 YTD 300 400 250 300 200 200 150 100 100 50 0 0
HISTORY OF AWARDS BY TYPE FY12 FY14 YTD Number of Submissions by Type Number of Awards by Type FY12 FY13 FY14 YTD FY12 FY13 FY14 YTD 450 800 400 700 350 600 300 500 250 400 200 300 150 200 100 100 50 0 0
History of Ancillary Agreements Negotiated Ancillary Agreements are inclusive of Confidential Disclosures, Material Transfers, Master Agreements, Licensing Agreements, Data Sharing Agreements and any other type of agreement that is ancillary to the funded research or collaboration. These types of agreements appear to be steadily increasing each year. ANCILLARY AGREEMENTS FY12-FY14 YTD 300 250 200 FY12 150 FY13 FY14 YTD 100 50 0 CDA MTA Unfunded Other Master TOTAL
REPORTING RESOURCE http://hsc.unm.edu/financialservic es/preaward/reports.shtml Provides Reports on Submissions and Awards by Fiscal Year and Calendar Year by College. Also additional reports on Ancillary Agreements.
QUESTIONS Visit our Website for additional Information: http://hsc.unm.edu/financialservices/preaward/


")