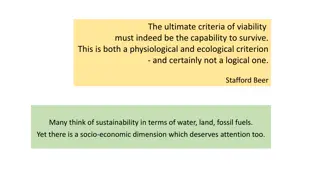
Spring Conference Understanding Viability
An individual development is considered viable when it offers a competitive return to the developer, taking into account all costs and regulatory factors. Viability evidence is essential for local plans, infrastructure levies, and planning applications. The NPPF emphasizes the importance of using appropriate available evidence when assessing viability to ensure deliverable plans without jeopardizing development potential.

Download Presentation

Please find below an Image/Link to download the presentation.
The content on the website is provided AS IS for your information and personal use only. It may not be sold, licensed, or shared on other websites without obtaining consent from the author.If you encounter any issues during the download, it is possible that the publisher has removed the file from their server.
You are allowed to download the files provided on this website for personal or commercial use, subject to the condition that they are used lawfully. All files are the property of their respective owners.
The content on the website is provided AS IS for your information and personal use only. It may not be sold, licensed, or shared on other websites without obtaining consent from the author.
E N D
Presentation Transcript
Spring Conference Understanding Viability Simon Drummond-Hay MRICS Tuesday 10th March 2015 www.pas.gov.uk
What is viability? An individual development can be said to be viable if, after taking account of all costs, including central and local government policy and regulatory costs and the costs and availability of development finance, the scheme provides a competitive return to the developer to ensure that development takes place and generates a land value sufficient to persuade a land owner to sell the land for the development proposed. If these conditions are not met, a scheme will not be delivered. Local Housing Delivery Group. Viability Testing in Local Plans Advice for planning practitioners. (LGA/HBF Sir John Harman) June 2012
Economic viability of a scheme Source: Financial Viability in Planning , RICS
When is viability evidence required? Plan-making Strategic Land Availability Assessment Whole local plan testing Community Infrastructure Levy Neighbourhood Planning Development Management Site specific viability testing for planning applications Masterplan/major application viability testing, incorporating phasing etc.
Keep it simple? NPPF says: Evidence supporting the assessment should be proportionate, using only appropriate available evidence . The CIL guidance says A charging authority must use appropriate available evidence (as defined in the Planning Act 2008 section 211(7A)) to inform their draft charging schedule. The Government recognises that the available data is unlikely to be fully comprehensive. Charging authorities need to demonstrate that their proposed levy rate or rates are informed by appropriate available evidence and consistent with that evidence across their area as a whole (NPPG ID: 25-019-20140612).
NPPF 173 Plans should be deliverable. Therefore, the sites and the scale of development identified in the plan should not be subject to such a scale of obligations and policy burdens that their ability to be developed viably is threatened. To ensure viability, the costs of any requirements likely to be applied to development, such as requirements for affordable housing, standards, infrastructure contributions or other requirements should, when taking account of the normal cost of development and mitigation, provide competitive returns to a willing land owner and willing developer to enable the development to be deliverable.
NPPF 174 Local planning authorities should assess the likely cumulative impacts on development in their area of all existing and proposed local standards, supplementary planning documents and policies that support the development plan, when added to nationally required standards. In order to be appropriate, the cumulative impact of these standards and policies should not put implementation of the plan at serious risk, and should facilitate development throughout the economic cycle. Evidence supporting the assessment should be proportionate, using only appropriate available evidence.
The Residual Valuation based approach Step 1: Gross Development Value (The combined value of the complete development) LESS Cost of creating the asset, including a profit margin (Construction + fees + finance charges + Developer s Profit, CIL, s106, CfSH etc.) = RESIDUAL VALUE Step 2: Residual Value v Existing Use Value
Gross Development Value All income from a Scheme CIL, Aff Housing, enviro, design, etc Construction Site Remediation Abnormals S106 Etc. Fees Design Engineer Sales Etc. Profit Developers Builders Land Existing / Alternative Land Value + uplift
The big question For a site to be viable, by how much must the Residual Value exceed the EUV? The cushion ? What does competitive return mean? What is the Viability Threshold You must understand the model, be able to interrogate the assumptions, be able to follow the calculation and challenge the test'. The cushion is central to developer behaviour. The Residual Method is very sensitive to inputs and assumptions.
Ever more cautious Put the overall development of the area at serious risk (2010) would not threaten delivery of the relevant Plan as a whole (2012) should not be subject to such a scale of obligations and policy burdens that their ability to be developed viably is threatened (ID: 10-001-20140306)
Justified? Brighton and Hove The Council s Combined Policy Viability Study, which was unfortunately finalised after the plan was submitted for examination, finds that the combined requirements of the Plan raise serious doubts about the viability of development across the Plan area. The Council seeks to rely on the flexibility clauses in the policies, which it says will enable development to go ahead. It is useful to build in such flexibility to allow for site specific issues to be taken into consideration, but this is not an acceptable substitute for ensuring that the plan facilitates development throughout the economic cycle, as required by the Framework (paragraph 174). I am therefore inviting you to draft modifications to the Plan to ensure that the requirements of the Framework are met in relation to this issue and in accordance with the evidence now available. In particular, you may wish to consider whether the requirements of Policy CP8 can be justified in this context, particularly bearing in mind forthcoming changes to the Building Regulations. Furthermore, the characteristics of the housing stock in Brighton are not dissimilar to those in many established urban areas and I am not convinced that this justifies a local requirement, which is more onerous than the national standards provided by the Building Regulations.
CIL/s106 trends moving forward CIL Reg 122 necessary to make the development acceptable in planning terms; directly related to the development; and fairly and reasonably related in scale and kind to the development. CIL Reg 123 From April 2015, councils will be restricted in relation to pooling S106 or s278 contributions from more than five developments (where the obligation in the s106 or s278 agreement is a reason for granting consent) CIL Regulations 123(3)
Harman v RICS Harman: We recommend that the Threshold Land Value is based on a premium over current use values and credible alternative use values. RICS: Threshold land value. A term developed by the Homes and Communities Agency (HCA) being essentially a land value at or above that which it is assumed a landowner would be prepared to sell. It is not a recognised valuation definition or approach.
Local Market Evidence is Needed Source: Savills
NPPG: Competitive return to developers and land owners This return will vary significantly between projects to reflect the size and risk profile of the development and the risks to the project. A rigid approach to assumed profit levels should be avoided and comparable schemes or data sources reflected wherever possible. A competitive return for the land owner is the price at which a reasonable land owner would be willing to sell their land for the development. The price will need to provide an incentive for the land owner to sell in comparison with the other options available. Those options may include the current use value of the land or its value for a realistic alternative use that complies with planning policy.
NPPG: Land Value Central to the consideration of viability is the assessment of land or site value. Land value should: reflect emerging policy requirements and planning obligations and, where applicable, any CIL charge; provide a competitive return to willing developers and land owners; and be informed by comparable, market-based evidence wherever possible. Where transacted bids are significantly above the market norm, they should not be used as part of this exercise.
Development site sales in County Durham Price Band Less than 9,999/acre Less than 24,706/ha 10,000 to 99,999/acre 24,707 to 247,059/ha 100,000 to 199,999/acre 247,060 to 494,199/acre 200,000 to 299,000/acre 494,200 to 741,299/ha 300,000 to 399,000/acre 741,300 to 988,399/ha 400,000 to 500,000/acre 988,400k to 1,235k/ha 3 6 2 1 2 1
WPV & plans found sound in 2014 Local Authority Barbergh Developer s Profit 17% Threshold Land Value 370,000/ha 20% on GDV 100,000- 400,000/ha Cannock Chase 20% on GDC 308,000/ha (un-serviced) 1,235,000/ha (serviced) Christchurch & East Dorset 20% market/6% Affordable 450,000/ha East Hampshire 17% 300,000/ha Erewash 15-20% 1-2m/ha (serviced) Fenland 20% market/17.5% large sites/6% Affordable 370,000- 430,000/ha GNDP 17.5% market/6% Affordable 500,000/ha Reigate & Banstead 20% (comprising 5% for internal overheads). 250,000/ha Stafford 17.5% market/6% Affordable 1.26- 1.41m/ha (serviced) Staffordshire Moorlands 17.5% 100,000- 300,000/ha Warrington
CIL, s106, affordable housing trade off Affordable housing 50,000 Viable level of CIL and Section 106 ( per plot) 0% 40,000 10% 30,000 20% 20,000 30% 40% 10,000 50% 0 150 175 200 225 250 275 300 325 350 New homes sales value ( per sq.ft.) Source: Savills
Development Management Appeals Barnet: APP/Q5300/ A/07/2043798/NWF Bristol: APP/P0119/ A/08/2069226 Beckenham: APP/G5180/ A/08/2084559 Bishops Cleeve; APP/G1630/A/11/2146206 Burgess Farm: APP/U4230/A/11/2157433 CLAY FARM: APP/Q0505/A/09/2103599/NWF Woodstock: APP/D3125/ A/09/2104658 Shinfield APP/X0360/ A/12/2179141 Oxenholme Road, APP/M0933/A/13/2193338 Vannes: Court of Appeal 22 April 2010, [2010] EWHC 1092 (Admin) 2010 WL 1608437
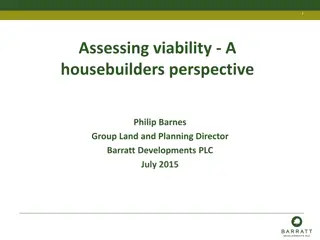
Shinfield APP/X0360/A/12/2179141 Reading University Wokingham Council 8th January 2013
Site and scheme 8.5 ha, 5 km south of Reading Was National Institute for Research into Dairying (closed in 1980s) 4.5 ha within development limits with buildings etc 4 ha beyond development limits pasture To clear site and build 126 new dwellings within development limits remainder to be open space etc
The problem The Council wanted 2,028,920 in developer contributions 40% affordable housing (policy says subject to viability) The Developer offered 2,312,569 in developer contributions 2% affordable housing Higher sales prices Lower developers profit Different Benchmark land value / site value
Developers Profit The appellants supported their calculations by providing letters and emails from six national housebuilders who set out their net profit margin targets for residential developments. The figures ranged from a minimum of 17% to 28%, with the usual target being in the range 20- 25%. Those that differentiated between market and affordable housing in their correspondence did not set different profit margins. Due to the level and nature of the supporting evidence, I give great weight it. I conclude that the national housebuilders figures are to be preferred and that a figure of 20% of GDV, which is at the lower end of the range, is reasonable.
Viable amount of affordable However, it would not result in the land being released for development. Not only is this SV well below that calculated by the appellants, there is no incentive to sell. In short, the appellants would not be willing landowners. If a site is not willingly delivered, development will not take place. The appellants, rightly in my opinion, say that this would not represent a competitive return. They argue that the uplift in value should be split 50:50 between the landowner and the Council. This would, in this instance, represent the identified s106 requirements being paid as well as a contribution of 2% of the dwellings as affordable housing.
And finally I conclude on this issue that, allowing the landowner a competitive return of 50% of the uplift in value, the calculations in the development appraisal allowing for 2% affordable housing are reasonable and demonstrate that at this level of affordable housing the development would be viable (Document 26). The only alterations to these calculations are the relatively minor
A Pragmatic Viability Test EUV Plus a premium reality checked against market value. Will EUV Plus provide competitive returns? Land owner s have expectations (life changing?) Will land come forward? PAS SUPPORT THIS APPROACH
Engagement Phases Delay at your peril Two or three stages
Ask for information early Landowners and site promoters should be prepared to provide sufficient and good quality information at an early stage . This will allow an informed judgement by the planning authority regarding the inclusion or otherwise of sites based on their potential viability. Harman Guidance Page 23 This viability report is provided on a confidential basis to the Council. We therefore request that the report should not be disclosed to any third parties (other than consultants instructed by the Council to review this report) under the Freedom of Information Act 2000 (sections 41 and 43(2)) or under the Environmental Information Regulations. RICS GN Paragraph 4.3.3
Confidentiality of viability Disclosure is often necessary, even where there is harm Aarhus/ Environmental Information Regulations ICO: Lakota Building (no harm), Hampton Court (harm, but disclosure) CLG Guidance May 2013 and particularly where there is an LPA land interest Summary data only, for public disclosure R (English) v East Staffs BC (2010) A balance is required Section 41 FOIA 2000 Is the information actually confidential? Is there really likely to be prejudice? Is there an overriding public interest? ICO: LB Southwark July 2013 Mechanisms to compromise Data ring 3rd party adviser
Design and viability Figure 8.1 Scheme Layouts Conventional Layout (A) Garden City Layout (B) Source: Nothing gained by overcrowding! TCPA 2012
Housing standards - Consultation https://www.gov.uk/government/uploads/system/uploads/attach ment_data/file/354095/03__140731__HSR_Supporting_Doc2_S pace.pdf This standard deals with internal space within new dwellings and is suitable for application across all tenures. It sets out requirements for the Gross Internal (floor) Area (GIA) of new dwellings at a defined level of occupancy as well as floor areas and dimensions for key parts of the home, notably bedrooms, storage and floor to ceiling height. Requirements may be exceeded but at the very least should be met. This standard is only applicable where a condition which is derived from a policy within a local plan is applied to a planning permission. This standard should be read alongside relevant guidance set in National planning policy.
Minimum gross internal floor areas and storage (m2) Minimum gross internal floor areas and storage (m2) number of bedspaces dwellings 1p 39(37)* 2p 50 3p 61 4p 70 4p 74 5p 86 6p 95 5p 90 6p 99 7p 108 8p 117 6p 103 7p 112 8p 121 7p 116 8p 125 number of bedrooms studio 1b 2b 1 storey 2 storey dwellings 3 storey dwellings built-in storage 1 58 70 79 84 93 102 97 106 115 124 110 119 128 123 132 1.5 2 3b 90 99 108 103 112 121 130 116 125 134 129 138 2.5 4b 3 5b 3.5 6b 4
DECC: EPC ratings & house prices
Another Consultation
BREEAM Sweet Group and Building Research Establishment Lower BREEAM ratings barely increase costs Higher ratings +/-2% additional costs Substantial savings over lifecycle
EUV + 20% + 400,000/ha on greenfield Table 10.4 Residual Value compared to 20% + 400,000/ha Uplift Viability Threshold ( /net ha) Alternative Land Value Threshold Affordable % Viability 0% 25% 30% 40% 35% Site 1 Site 2 Urban Edge 1 Urban Edge 2 Office re- development Estate Infill LSC Infill LSC Infill Cleared Urban KSC Urban Edge LSC Edge LSC Edge LSC Paddock Small Village Ex Garage Site Village Infill Village Infill Rural House Kendal Kendal 25,000 25,000 430,000 430,000 1,443,027 1,455,240 1,148,255 1,130,680 1,083,908 1,059,830 948,778 911,045 1,017,109 986,281 Site 3 Site 4 Site 5 Site 6 Site 7 Site 8 Site 9 Site 10 Site 11 Site 12 Site 13 Site 14 Site 15 Site 16 Kendal Kendal Arnside Grange Ulverston Milnthorpe Allithwaite Endmoor Penny Bridge Lune Valley Central SLDC Cartmel Peninsula Eastern Area Rural west 400,000 50,000 50,000 50,000 300,000 25,000 50,000 50,000 50,000 50,000 400,000 50,000 50,000 50,000 480,000 460,000 460,000 460,000 360,000 430,000 460,000 460,000 460,000 460,000 480,000 460,000 460,000 310,000 732,148 1,716,295 1,089,497 1,315,092 399,698 1,319,627 1,879,318 1,266,331 1,648,636 1,952,203 457,674 1,522,498 552,018 75,454 412,529 1,404,668 860,561 1,015,954 153,528 1,034,413 1,474,114 1,000,000 1,320,890 1,952,203 212,560 1,203,186 552,018 75,454 346,134 1,333,530 808,331 950,654 100,147 971,956 1,385,383 949,065 1,245,698 1,952,203 159,053 1,130,073 552,018 75,454 198,171 1,182,385 698,649 813,524 -13,273 841,158 1,210,926 825,151 1,088,227 1,952,203 46,688 976,954 552,018 75,454 272,991 1,258,469 754,112 882,866 43,821 908,733 1,307,848 889,158 1,169,586 1,952,203 103,507 1,056,066 552,018 75,454 Castle Green Road Quarry Lane South Ulverston Ulverston Canal Head Kendal Storth Ulverston 25,000 25,000 25,000 430,000 430,000 430,000 1,098,652 1,175,868 852,535 858,474 866,671 623,926 806,045 799,175 573,994 695,942 663,665 469,132 751,618 729,108 522,158 Ulverston 300,000 360,000 928,748 625,484 559,283 424,244 495,210
1,000,000 viability Threshold Table 10.3 Residual Value compared to 1,000,000/ha Viability Threshold ( /net ha) Alternativ e Land Value Viability Threshol Affordable % d 0% 25% 30% 40% 35% 1,000,00 Site 1 Urban Edge 1 Kendal 25,000 0 1,443,027 1,148,255 1,083,908 948,778 1,017,109 1,000,00 Site 2 Urban Edge 2 Kendal 25,000 0 1,455,240 1,130,680 1,059,830 911,045 986,281 1,000,00 Site 3 Office re-development Kendal 400,000 0 732,148 412,529 346,134 198,171 272,991 1,000,00 Site 4 Estate Infill Kendal 50,000 0 1,716,295 1,404,668 1,333,530 1,182,385 1,258,469 1,000,00 Site 5 LSC Infill Arnside 50,000 0 1,089,497 860,561 808,331 698,649 754,112 1,000,00 Site 6 LSC Infill Grange 50,000 0 1,315,092 1,015,954 950,654 813,524 882,866 1,000,00 Site 7 Cleared Urban Ulverston 300,000 0 399,698 153,528 100,147 -13,273 43,821 1,000,00 Site 8 KSC Urban Edge Milnthorpe 25,000 0 1,319,627 1,034,413 971,956 841,158 908,733 1,000,00 Site 9 LSC Edge Allithwaite 50,000 0 1,879,318 1,474,114 1,385,383 1,210,926 1,307,848 1,000,00 Site 10 LSC Edge Endmoor 50,000 0 1,266,331 1,000,000 949,065 825,151 889,158 1,000,00 Site 11 LSC Paddock Penny Bridge 50,000 0 1,648,636 1,320,890 1,245,698 1,088,227 1,169,586 1,000,00 Site 12 Small Village Lune Valley 1,952,203
Developers Profit 20% and 25% GDV Table 10.5 Residual Value compared to 20% + 400,000/ha Uplift Viability Threshold ( /net ha) Developers return of 20% and 25% 20% GDV 1,017,109 986,281 272,991 1,258,469 754,112 882,866 43,821 908,733 1,307,848 889,158 1,169,586 1,952,203 103,507 1,056,066 552,018 75,454 25% GDV 831,087 772,718 30,763 988,341 565,668 694,863 -262,517 712,529 1,060,360 703,008 960,717 1,677,952 -73,964 854,394 455,105 58,142 Site 1 Site 2 Site 3 Site 4 Site 5 Site 6 Site 7 Site 8 Site 9 Site 10 Site 11 Site 12 Site 13 Site 14 Site 15 Site 16 Urban Edge 1 Urban Edge 2 Office re-development Estate Infill LSC Infill LSC Infill Cleared Urban KSC Urban Edge LSC Edge LSC Edge LSC Paddock Small Village Ex Garage Site Village Infill Village Infill Rural House Kendal Kendal Kendal Kendal Arnside Grange Ulverston Milnthorpe Allithwaite Endmoor Penny Bridge Lune Valley Central SLDC Cartmel Peninsula Eastern Area Rural west 25,000 25,000 400,000 50,000 50,000 50,000 300,000 25,000 50,000 50,000 50,000 50,000 400,000 50,000 50,000 50,000 430,000 430,000 480,000 460,000 460,000 460,000 360,000 430,000 460,000 460,000 460,000 460,000 480,000 460,000 460,000 310,000 Castle Green Road Quarry Lane South Ulverston Ulverston Canal Head Kendal Storth Ulverston Ulverston 25,000 25,000 25,000 300,000 430,000 430,000 430,000 360,000 751,618 729,108 522,158 495,210 615,149 538,318 343,462 259,067
Viability Threshold = 25% of GDV Table 10.7 Residual Value compared to Viability Threshold of 25% of GDV GDV % GDV 6,913,157 8,618,523 437,822 486,466 1,203,047 1,786,160 446,532 3,272,776 1,144,582 568,498 933,411 250,500 206,952 492,721 171,188 97,500 Residual 5,339,823 5,720,430 84,627 377,541 754,112 1,324,299 10,955 2,271,833 980,886 444,579 818,710 292,831 20,701 422,426 165,605 75,454 % of GDV Site 1 Site 2 Site 3 Site 4 Site 5 Site 6 Site 7 Site 8 Site 9 Site 10 Site 11 Site 12 Site 13 Site 14 Site 15 Site 16 Urban Edge 1 Urban Edge 2 Office re-development Estate Infill LSC Infill LSC Infill Cleared Urban KSC Urban Edge LSC Edge LSC Edge LSC Paddock Small Village Ex Garage Site Village Infill Village Infill Rural House Kendal Kendal Kendal Kendal Arnside Grange Ulverston Milnthorpe Allithwaite Endmoor Penny Bridge Lune Valley Central SLDC Cartmel Peninsula Eastern Area Rural west 27,652,629 34,474,092 1,751,290 1,945,866 4,812,189 7,144,640 1,786,127 13,091,105 4,578,328 2,273,993 3,733,644 1,002,000 827,808 1,970,884 684,750 390,000 19% 17% 5% 19% 16% 19% 1% 17% 21% 20% 22% 29% 3% 21% 24% 19% Castle Green Road Quarry Lane South Ulverston Ulverston Canal Head Kendal Storth Ulverston Ulverston 11,024,904 7,045,698 111,430,801 12,225,882 2,756,226 1,761,425 27,857,700 3,056,471 2,314,982 1,035,333 11,581,459 955,755 21% 15% 10% 8%
Shinfield Test We do not accept that Shinfield is an authoritative precedent for Plan wide viability testing Under the Shinfield principles the uplift from granting planning consent is shared 50:50 between the landowner and the local authority.
Shinfield Test Residual - No affordable, no developer contributions Residual - Base Modelled Existing Use Shinfield Threshold Value Site 1 Site 2 Site 3 Site 4 Site 5 Site 6 Site 7 Site 8 Site 9 Site 10 Site 11 Site 12 Site 13 Site 14 Site 15 Site 16 Urban Edge 1 Urban Edge 2 Office re-development Estate Infill LSC Infill LSC Infill Cleared Urban KSC Urban Edge LSC Edge LSC Edge LSC Paddock Small Village Ex Garage Site Village Infill Village Infill Rural House Kendal Kendal Kendal Kendal Arnside Grange Ulverston Milnthorpe Allithwaite Endmoor Penny Bridge Lune Valley Central SLDC Cartmel Peninsular Eastern Area Rural west 25,000 25,000 400,000 50,000 50,000 50,000 300,000 25,000 50,000 50,000 50,000 50,000 400,000 50,000 50,000 50,000 1,043,694 1,049,780 797,456 1,239,640 1,038,143 1,020,043 475,187 898,153 1,445,461 936,945 1,274,754 1,494,704 496,992 780,162 567,592 77,027 534,347 537,390 598,728 644,820 544,071 535,022 387,594 461,576 747,731 493,472 662,377 772,352 448,496 415,081 308,796 63,513 711,976 686,726 272,991 878,002 685,556 662,150 43,821 597,851 980,886 635,113 880,333 1,464,153 103,507 528,033 552,018 75,454
Full Policy + Developer Contributions Table 10.9 Impact of different Developer Contributions Developer Contributions. / unit (market and affordable) Alternative Use Value Viability Threshold /ha /ha 1,500 2,500 5,000 7,500 10,000 Site 1 Urban Edge 1 Kendal 25,000 430,000 985,133 905,194 825,255 745,315 1,017,109 Site 2 Urban Edge 2 Office re- development Estate Infill Kendal 25,000 430,000 951,307 863,874 776,440 689,006 986,281 Site 3 Kendal 400,000 480,000 229,023 119,103 9,184 -100,736 272,991 Site 4 Kendal 50,000 460,000 1,217,735 1,115,898 1,014,061 912,225 1,258,469 Site 5 LSC Infill Arnside 50,000 460,000 718,807 630,544 542,282 458,364 754,112 Site 6 LSC Infill Grange 50,000 460,000 852,889 777,946 703,003 634,013 882,866 Site 7 Cleared Urban Ulverston 300,000 360,000 -6,505 -132,321 -258,137 -385,862 43,821 Site 8 KSC Urban Edge Milnthorpe 25,000 430,000 878,356 802,414 726,471 650,529 908,733 Site 9 LSC Edge Allithwaite 50,000 460,000 1,275,569 1,194,872 1,114,175 1,033,478 1,307,848 Site 10 LSC Edge Endmoor 50,000 460,000 858,607 782,230 705,852 629,475 889,158 Site 11 LSC Paddock Penny Bridge 50,000 460,000 1,139,324 1,063,671 988,017 912,364 1,169,586 Site 12 Small Village Lune Valley 50,000 460,000 1,925,047 1,857,156 1,789,265 1,721,374 1,952,203 Site 13 Ex Garage Site Central SLDC 400,000 480,000 77,296 11,767 -53,763 -119,292 103,507 Site 14 Village Infill Cartmel Peninsula 50,000 460,000 1,030,607 966,959 903,311 839,663 1,056,066 Site 15 Village Infill Eastern Area 50,000 460,000 541,636 515,680 489,724 463,768 552,018 Site 16 Rural House Rural west 50,000 310,000 74,406 71,785 69,163 66,542 75,454
Carveth Read: It is better to be vaguely right than exactly wrong Logic, deductive and inductive (1898), p. 351