Stabilisation Wedges for Climate Change
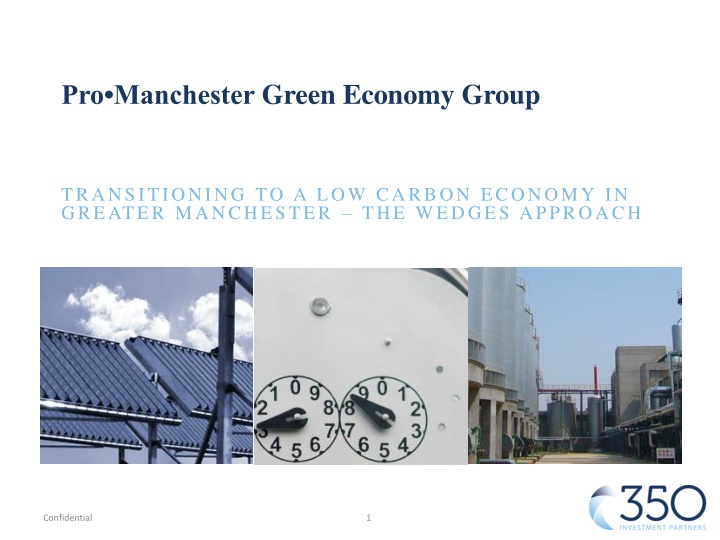
Stabilisation wedges offer a strategy to stabilize CO2 emissions and combat climate change. Developed by Pacala & Socolo in 2004, this approach involves implementing various solutions across different sectors such as energy efficiency, fossil fuel optimization, nuclear power, and renewables. By understanding and implementing these wedges, we can work towards transitioning to a low-carbon economy and ensuring a sustainable future for Greater Manchester and beyond.

Download Presentation

Please find below an Image/Link to download the presentation.
The content on the website is provided AS IS for your information and personal use only. It may not be sold, licensed, or shared on other websites without obtaining consent from the author.If you encounter any issues during the download, it is possible that the publisher has removed the file from their server.
You are allowed to download the files provided on this website for personal or commercial use, subject to the condition that they are used lawfully. All files are the property of their respective owners.
The content on the website is provided AS IS for your information and personal use only. It may not be sold, licensed, or shared on other websites without obtaining consent from the author.
E N D
Presentation Transcript
ProManchester Green Economy Group TRANSITIONING TO A LOW CARBON ECONOMY IN GREATER MANCHESTER THE WEDGES APPROACH Confidential 1
What are wedges? Theory developed by Pacala & Socolo from the University of Princeton in 2004 Global view of how we could stabilise the current increase in CO2 emissions The concept behind the theory is: To limit atmospheric CO2 to a concentration that would prevent most damaging climate change have focused on a goal of 500 +/- 50 parts per million (ppm) This is less than double the pre-industrial concentration of 280 ppm. The current CO2 concentration is c. 400ppm this was 375 ppm in 2004. Using technologies to stabilise CO2 within the next 50 years which already exist. Represents a 1 GtC/year of reduced carbon emissions by 2055. Confidential 2
Choice of 7 wedges to stop the current path of CO2 increase over the next 50 years or 12 for a reduction to 350ppm 7 wedges are needed to build the stabilisation Wedge Significant changes needed to energy supply and demand to stabilise emissions at 500ppm twice pre industrial level of 280ppm Stabilization Triangle 1 wedge avoids 1 billion tonnes of carbon emissions per year by 2050 14 1 wedge 1 wedge Flat path Flat path Stabilization Triangle Gtc*/year 7 0 1950 2000 2050 Source: Pacala & Socolow, Univ. of Princeton *Gtc means billion of metric tons of carbon. Confidential 3
The key challenge is that stabilisation wedges require massive scale up Energy Efficiency &Conservation Fossil Fuel-Based Strategies Stabilization Stabilization Triangle Triangle Renewables & Biostorage 2000 2050 Nuclear Power No single technology or policy can provide the answer The technology for all the above areas exit today The opportunity is to bring down cost 1 wedge represents $2.5 trillion in cost the global economy for CO2 levels by 2050 at $100/tC Confidential 4
So what does a global wedge look like? Energy efficiency Increase the fuel economy of 2 billion cars from 30mpg to 60mpg OR Half the average miles travelled from 10,000 miles/yr to 5,000 miles/yr Cut the emissions from buildings by 25% Replacing all incandescent light bulbs to fluorescent tubes would be 0.25 wedge Fossil Fuels Increase the efficiency of coal fired plants from 30% to 60% Displacing 1400 coal fired power stations with gas by 2055 Carbon capture and storage from 800 coal fired plants or 1600 gas fired plants Nuclear Add 700GW of nuclear capacity (twice the current capacity) to replace coal Renewables A 10 times increase in global wind generation capacity to 2 million 1MW turbines Increase solar deployment by 100 times to 2000GWp Use 40,000 km2 solar panels or 4m wind turbines to produce hydrogen for fuel cell cars Deforestation Reforest 400m hectares Confidential 5
Linking Global stabilisation to a UK emissions target IPCC recommended in 1996 a stabilisation of 550ppm Required a significant contribution from developed nations Kyoto Protocol In 2000 Royal Commission on Environmental Pollution recommended a 60% reduction to achieve this target 2008 G8 meeting on environment in Exeter concluded that 60% was not sufficient Stabilisation would occur below 400ppm Increased reduction to 80% by 2050 Introduction of UK Climate Change Act in 2008 2011 Coalition introduced Carbon budgets for mid 2020 1st Budget 2008-2012 2nd Budget 2013-17 3rd Budget 2018-22 4th Budget 2023-27 Reduction below 1990 base levels 23% 29% 35% 50% Confidential 6
So what has the UK done to date? Emissions from power stations reduced by 25% shift from coal to gas generation in 1990 s 25% generation from low carbon sources Renewables providing ~10% Nuclear ~15% of generation capacity Buildings reduced emissions by 18% Shift to condensing boilers Loft insulation and cavity wall insulation Transport emissions largely unchanged Average car emissions reduced by 1/3rd Car traffic increased over the period Industry has reduced emissions by 46% Move away from heavy manufacturing to knowledge based economy Potential effect on regional employment Confidential 7
What are the UK wedges up to 2020? Buildings Cavity wall insulation - 2.6-7.5m homes (increase from 10.8m) Solid wall insulation 1-3.7m homes Low carbon heating, e.g. air/ground source heating 1.6m homes Zero carbon buildings 2016 Domestic / 2019 Non-domestic Transport Reduction of EU emission targets over period cars 130 to 95gCO2/km, vans 175 to 147gCO2/km Setting up Ultra Low Emission Vehicle infrastructure Industry Switch to low carbon alternative for heat e.g. biomass heating and CHP Increase conventional energy efficiency measures 10% reduction through low cost options and increased recycling Energy Generation Renewable power anticipated to be 30% of mix by 2030 40-70GW of low carbon electricity capacity installed by 2030 nuclear and renewables Confidential 8
Greater Manchester Low Carbon Hub Mark Atherton
Greater Manchesters Strategic Framework Greater Manchester Strategy (2013) Climate Change Strategy (2012) + Transport + Waste High level frameworks to 2020 Climate Change Implementation Plan (2013 - 2015) What we will achieve by 2015 Thematic Work Programmes (2013) What we will do this year
Greater Manchester Low Carbon Hub A centre of excellence for achieving economic gain through the integrated delivery of carbon reduction. Harnesses the knowledge of our universities with the innovation of our businesses and strong public governance. Key Inner Hub -Hub Board and Core Team Radial Existing partnerships and resources Inner Ring Thematic delivery groups Mid Ring Wider Greater Manchester Public, Private and Voluntary Sector Outer Ring Government Departments
Delivery Approach Themes and Sub-groups Skills and Sector Development Enable and Measure Outcomes
Low Carbon Hub Priorities 2013/14 Buildings Develop and deliver ECO 2013 Procure, develop and deliver Green Deal 2014-2016 Develop retrofit programme for local authority buildings for JV with GIB Energy Develop the concept of a GM Energy Enterprise which would enable GM to develop, trade and manage energy assets, tariffs and consumption Conduct heat trials and feasibility studies (including NEDO, networks and ETI bid) Review GM domestic and commercial energy procurement to identify opportunities Cross-cutting big issues: Explore potential of public sector procurement for LCEGS sector and local benefit Skills Analysis of skills requirements Understand existing provision and develop courses to match market need Increase innovation to meet priorities via RGF and EOS Develop common framework for carbon metrics to support decision making Sector growth Raise the profile of the sector Deliver a sector development programme Maximise the effectiveness of procurement practices Attract inwards investment from overseas Develop the concept of a GM Energy Enterprise Transport Agree governance arrangements Establish emissions baselines and explore interventions to deliver carbon reduction via work plan Enhance communication between the hub and its stakeholders SCP Identify and support areas where we can make the most difference Regularly communicate to a wide audience Secure the funds needed to enable GM companies to operate more sustainably Integrate SCP services into the wider financial investment packages Natural Capital Identify key natural capital assets for GM to be protected and enhanced Progress our ecosystem services work Develop an investment framework to target resources at key assets Adaptation and resilience Funding and resources
What Has Been Achieved? Low Carbon Hub established as centre of excellence Joint Climate Change Implementation Plan produced Memorandum of Understanding (MoU) with DECC and Defra Develop a pipeline of low carbon capital projects and designing a vehicle to deliver projects Get me Toasty, PV and ECO programmes 57000 people engaged on Energy Switching New Enworks Resource Efficiency & Sector Development Project AWARM Fuel Poverty alleviation programme Electric Vehicle Charging Scheme, Metrolink extension and Ticket to Kyoto UK s first Thermophyllic MBT Plant Improved communications bulletins and websites
GM Annual Carbon Emissions by Sub-Sector (ktonnes CO2) 20000 18000 16000 14000 12000 10000 8000 6000 4000 2000 0 2005 2006 2007 2008 2009 2010 2011 A. Industry and Commercial Electricity B. Industry and Commercial Gas C. Large Industrial Installations D. Industrial and Commercial Other Fuels E. Agricultural Combustion F. Domestic Electricity G. Domestic Gas H. Domestic 'Other Fuels' I. Road Transport (A roads) J. Road Transport (Motorways) K. Road Transport (Minor roads) L. Diesel Railways M. Transport Other
Low Carbon Assets Portfolio Weighted (Allowing for risk) c 320m
Wedges Options? Electricity Buildings and Heat Transport On-shore renewables eg small scale wind and hydro Replacement of oil-fired boilers Encourage smarter choices Promotion of PV Low Carbon Heat Networks Improved travel planning CHP Cavity/Solid wall insulation Enhanced cycle/foot routes Energy from Waste Intelligent heating controls Low carbon buses Introduce smart grid Loft Insulation Extend public transport provision Deployment of energy efficiency appliances Domestic heat pumps Electric vehicle infrastructure Extractable heat from industry
GM Total annual carbon emissions and targets (ktonnes CO2) 25000 20000 15000 10000 5000 0 2005 2006 2007 2008 2009 2010 2011 2012 2013 2014 2015 2016 2017 2018 2019 2020 Industry and Commercial Total Domestic Total Transport Total Grand Total Baseline Targets
Assumptions Carbon emissions won t continue to decrease at the current rate if the economy recovers, as predicted National policy will reduce GM emissions by 36% compared to 1990 GM will need to find a further 12% or 2.5MtCO2e to meet the 48% target
2015-2020 GM emissions savings wedge 16000000 14000000 Actual Predicted 2020 Target 2.5MtCO2e 12000000 10000000 2008 2010 2012 2014 2016 2018 2020 2022
Illustrative wedges graph 16000000 Commercial buildings 14000000 Actual Predicted Community wind 2020 Target 2.5MtCO2e Electric vehicles 12000000 10000000 2008 2010 2012 2014 2016 2018 2020 2022
pro.manchester Green Economy Group pro.manchester Green Economy Group Feedback from GM Low Carbon Hub Feedback from GM Low Carbon Hub Workshops of 11 Workshops of 11th th February 2014 February 2014 Anthesis Consulting Group 19 February 2025
Content Content Workshop format Sir Richard Leese opening the Workshop The suggestions and ideas Reflections from Mark Atherton Anthesis Consulting Group
Workshop format Workshop format Introductions to wedges Context for GM region Discussions on four broad themes Transport Renewables Domestic Business Voting Best approaches for delivering low carbon savings Lowest cost for implementation Anthesis Consulting Group
Wedge idea Encourage electric vehicles & charging infrastructure & in council fleets and taxis Continue development of cycle / walking routes & cycle Hub Smart Oyster card for all forms of transport Improved transport into city centre eg Park and Ride Changing working partners eg virtual working GM Integrated Infrastructure Plan for low carbon transport Electric buses eg Milton Keynes Carbon saving potential vote Cost vote 8 0 5 13 14 22 Transport 7 22 3 2 9 4 4 0 Wedge idea Smart metering behaviour change Enhanced Green Deal for deep (80%) carbon savings link to council tax rebate Community champions to promote schemes (help with behaviour change) Heat Networks Electric demand reduction via lighting Different economic models to drive change eg small scale EPC Carbon saving potential vote Cost vote 14 20 3 1 2 13 Domestic 12 3 0 7 2 2
Transport Transport Adoption of a smart Oyster card for GM to cover all modes of public transportation. Possibly enabled via smartphone technology to reward individuals who make better choices via adopting a cashless wallet concept Improved transport links (and park and ride facilities) to enable greater use of public transport (especially the Tram network) Continue development of cycle/walking routes and creation of more cycle Hubs Anthesis Consulting Group
Renewables Renewables Heat networks good carbon saving potential costs (and disruption) questioned Community budgeting to finance projects scale of carbon reduction questioned Ground mounted PV programme on marginal land/derelict land awaiting development Anthesis Consulting Group
Domestic Domestic Widespread implementation of smart metering to drive behaviour change Implementation of heat networks great carbon savings, but questioned on basis of capital cost Promotion of community champions low cost to implement, but effectiveness was questioned Anthesis Consulting Group
Business Business Use and adoption of smart metering allied to tax incentives to try and overcome the ever present landlord-tenant conundrum Up skilling advisors with, for example, R&D tax and capital allowances to facilitate the adoption of low carbon technologies Green tariff energy procurement to drive market change Provision of a GM-wide asset register to identify opportunities for the implementation of energy efficiency/renewable energy etc. opportunities. Perhaps the starting point for contextualising all of the above??? Anthesis Consulting Group
Reflections Reflections What s been missed? What can be learned from other cities and countries? Level of ambition? Anthesis Consulting Group


")


")