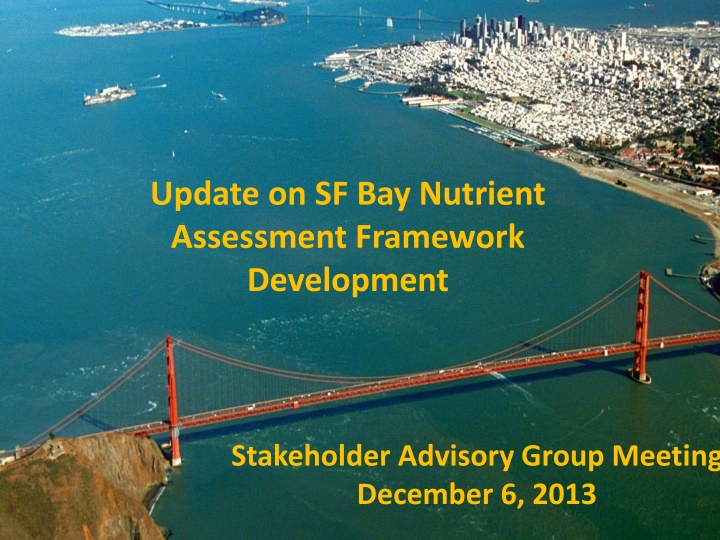
Stakeholder Advisory Group Meeting Update
SF Bay Nutrient Assessment Framework Development progress update, including conceptual model, modeling strategy, monitoring programs, and assessment framework details. The process and schedule for framework development, as well as discussions from previous stakeholder meetings, are also highlighted.

Uploaded on Feb 17, 2025 | 1 Views
Download Presentation

Please find below an Image/Link to download the presentation.
The content on the website is provided AS IS for your information and personal use only. It may not be sold, licensed, or shared on other websites without obtaining consent from the author.If you encounter any issues during the download, it is possible that the publisher has removed the file from their server.
You are allowed to download the files provided on this website for personal or commercial use, subject to the condition that they are used lawfully. All files are the property of their respective owners.
The content on the website is provided AS IS for your information and personal use only. It may not be sold, licensed, or shared on other websites without obtaining consent from the author.
E N D
Presentation Transcript
Update on SF Bay Nutrient Assessment Framework Development Stakeholder Advisory Group Meeting December 6, 2013
Context for Assessment Framework Conceptual Model Assessment Framework Modeling Strategy Nutrient-Response Model Development and Validation SF Bay Monitoring Program Core Monitoring and Special Studies Regulatory NPS Control Basin Plan Objectives Waterbody Assessments and 303(d) listing NPDES Permit Limits
What is An Assessment Framework? Decision support Transparent Peer-reviewed Capacity to evolve framework as science advances Indicators, metrics & endpoints may differ by Bay segment or season Key components Supported by SF Bay conceptual models Specifies what to measure, temporal and spatial frequency in which those indicators/metrics should be measured Specifies how to use data to classify the Bay (or segments of the Bay) in risk categories Assessment frameworks do not: Specify regulatory thresholds that is a policy decision
Process and Schedule to Develop Assessment Framework Begin with conceptual models Identify indicators, linkages to beneficial uses at relevant spatial and temporal scales Review available assessment frameworks White paper that synthesizes approaches, data required Utilize those frameworks with existing SF Bay data (if available) to demonstrate applicability Inform decision-making Utilize demo results, in tandem with conceptual models, to craft strawman framework with experts Demonstrate with existing data Vete and refine assessment framework ( repeat) Fall 2012 Spring 2013 Fall 2013 Spring 2014 Summer 2014
At Previous Stakeholder Meetings. Discussed work plan to create assessment framework Presented white paper summarizing existing approaches to creating assessment frameworks Site-specific (Chesapeake Bay chlorophyll a criteria) Regional (Florida, European Water Framework Directive)
Progress Since Last Meeting Completed preliminary analysis of existing data Held first conference call of expert team to lay groundwork First workshop is scheduled for February 2014
Who Are The Experts International experts in assessment frameworks, criteria: Suzanne Bricker (NOAA) Larry Harding (University of Maryland/UCLA) James Hagy (EPA ORD) Local experts in SF Bay nutrient biogeochemistry and eutrophication, but not limited to: Jim Cloern Dick Dugdale Raphael Kudela Anke Mueller-Solger
Whats Ahead: Three 2-Day Experts Workshops To Develop Draft Framework Workshop 1 (January-February 2014) Confirm indicators (and metrics) of interest Agree on SF Bay segments and targeted habitats Identify temporal elements of assessment framework Identify spatial elements of assessment framework Workshop 2 (March- April 2014) Develop proto-monitoring program Discussion of thresholds for classification scheme Workshop 3 (May-June 2014) Develop classification scheme by Bay segment Discuss uncertainty associated with classification scheme Conference calls (June July 2014) Comment on assessment framework document
Conceptual Model Development Lays Groundwork for Assessment Framework Problem statement: Management endpoints of concern (primary indicators) Elevated chlorophyll a biomass and/or primary productivity Increased frequency and duration of phytoplankton blooms Reduced chlorophyll a biomass and/or primary productivity Imbalanced phytoplankton community composition Harmful algal species and toxin concentrations Low dissolved oxygen concentrations
Conceptual Model Discussions Confirm Preliminary Assessment of Indicator Suitability Primary Dissolved oxygen Chlorophyll a (biomass) and/or primary productivity HAB species and toxin concentration Cyanobacteria Supporting Phytoplankton assemblages or taxonomic composition Nutrient concentrations and/or ratios
White Paper Outline Context for assessment framework Conceptual approach to nutrient objectives in SF Bay Previous work Review of existing approaches Regulatory (Chesapeake Bay, Florida) and non-regulatory How is the approach used to assess waterbody condition What is the basis of the ranking Indicators, categories, thresholds Method used to measure indicator Data requirements for the assessment How are the data used to calculate the score/category
Objective of Analysis of Existing Data Inform the process of developing an appropriate assessment framework and monitoring program Test out existing indicators and assessment frameworks using real data Understand how categorization of condition varies as function of magnitude, frequency and duration (thresholds, space and time) Provoke a visceral reaction from local experts to bring home options that we are considering First phase of analysis pending feedback from group application of existing frameworks to SF Bay does not imply that we are going to use them!!! Just a jumping off point for discussion!!
Frameworks Supported By Existing Data Water Framework Directive (United Kingdom) Phytoplankton index based on chlorophyll a Taxa index Assessment of Estuarine Trophic Status (ASSETS) Chlorophyll a The French Research Institute for the Exploration of the Sea (IFREMER) Classification for Mediterranean Lagoons
Indicators: UK-WFD Phytoplankton Each statistic is given a point value of 1 if it does not exceed the threshold, the sum of points accumulated yields the final classification. Low Salinity Threshold (0-25 ppt) High Salinity Threshold (> 25 ppt) Points Classification Statistic 5 High 15 g L-1 10 g L-1 Average Annual CHL-a 4 Good 12 g L-1 8 g L-1 Median Annual CHL-a 3 Moderate % CHL-a less than 10 g L-1 > 70 % > 75 % 2 Low % CHL-a less than 20 g L-1 > 80 % > 85 % 0-1 Very Low % CHL-a less than 50 g L-1 < 5 % < 5 % Classification presented with respect to ecological condition
Indicators: UK-WFD Taxa Classification is assessed as the sum of a series of exceedences Sum of % Exceedences (CHL + S + P + T) Index Statistic Threshold Classification > 10 g L-1 CHL Chlorophyll (CHL) 0-10 High > 106 cells L-1 S Any phytoplankton taxa (S) 10-20 Good Phaeocystis sp.* (P) *used Cyanobacteria > 106 cells L-1 P 20-40 Moderate 40-60 Low > 107 cells L-1 T Total taxa counts (T) 60-100 Very Low Classification presented with respect to ecological condition
Indicators: IFREMER Classification is assessed using a series of indicators and thresholds focus on chlorophyll a Ecological Condition Moderate 30-40 20-30 1-1.5 Indicator Unit High <20 <10 <0.3 Good 20-30 10-20 0.3-1 Low 40-50 30-40 1.5-4 Very Low >50 >40 >4 %O2 Saturation Turbidity phosphate Dissolved inorganic nitrogen Nitrite Nitrate Ammonia CHL-a CHL-a + phaeopigments Total nitrogen Total phosphorus % SAT NTU M M <15 15-20 20-40 40-60 >60 M M M g L-1 g L-1 M M <0.5 <7 <7 <5 <7 <50 <1 0.5-1 7-10 7-10 5-7 7-10 50-75 1-2 1-5 10-20 10-20 7-10 10-15 75-100 2-5 5-10 20-30 20-30 10-30 15-40 100-120 5-8 >10 >30 >30 >30 >40 >120 >8 Classification presented with respect ecological condition
Indicators: ASSETS Classification is assessed using a multi metric approach For this analysis, chlorophyll a assessed independently 90th Percentile Annual CHL a < 5 mg L-1 5 20 mg L-1 20 -60 mg L-1 60 mg L-1 Classification Low Medium High Hypereutrophic Classification presented with respect to status of eutrophication
Data Sets Used for Analysis of Existing Data USGS Water Quality Monitoring Surveys Chlorophyll (1975-present) Dissolved oxygen (1971-present) Inorganic nutrients (1971-present) Interagency Ecological Program (IEP) Bay Delta monitoring program (CA Department of Water Resources) Chlorophyll (1975-present) Taxa (1975-present) Dissolved oxygen (1971-present) Inorganic nutrients (1971-present) Total nutrients (1971-present) Turbidity (1975-present)
Preliminary Segmentation of the Bay Habitat types of SFB and surrounding Baylands. Water Board subembayments boundaries are shown in black. Habitat data from CA State Lands Commission, USGS, UFWS, US NASA and local experts were compiled by SFEI.
Preliminary Bay Segments Used to Aggregate USGS and IEP Data Into Sub-basins Suisun, San Pablo, Upper South Bay, Lower South Bay
Approach Classify sub-basins using existing approaches Compare outcomes based on varying data integration methods Inter-annual variability (yearly, six year running average) Temporal integration of annual data (seasonal, annual average, annual median, percentile) Spatial integration Use as a jumping off point to consider options for what to develop specifically for SF Bay
Defining How to Use Data to Make An Assessment Critical Period? Annual Average? Median Value? Percentile? Growing Season ? Monthly average chl-a (mg m-3) 2006-2011 20 20 Suisun San Pablo 15 10 10 5 5 0 0 O J S M A M F D J A N J O J S M A M F D A N J Data source: http://sfbay.wr.usgs.gov/access/wqdata/
Effect of Threshold and Temporal Aggregation on Categorization: North Bay ASSETS Thresholds IFREMER Thresholds 70 40 ASSETS Thresholds 90th%tile Growing Season (Mar-Sep) Annual Average Median Growing Season (Mar-Sep) Annnual Average Median 90th%tile 35 60 30 50 Chlorophyll (ug/L) Chlorophyll (ug/L) 25 40 20 30 15 20 10 10 5 0 0 1975 1980 1985 1990 1995 2000 2005 2010 1975 1980 1985 1990 1995 2000 2005 2010 Year Year
Targeted Habitats and Effect of Spatial Aggregation on Categorization San Pablo Bay Suisun Bay South of Dumbarton Bridge South Bay
Three 2-Day Workshops, With 1-2 Conference Calls To Revise Draft Framework Workshop 1 (January-February 2014) Confirm indicators (and metrics) of interest Agree on SF Bay segments and targeted habitats Identify temporal elements of assessment framework Identify spatial elements of assessment framework Workshop 2 (March- April 2014) Develop proto-monitoring program Discussion of thresholds for classification scheme Workshop 3 (May-June 2014) Develop classification scheme by Bay segment Discuss uncertainty associated with classification scheme Conference calls (June July 2014) Comment on assessment framework document
Context for Assessment Framework Conceptual Model Assessment Framework Modeling Strategy Nutrient-Response Model Development and Validation SF Bay Monitoring Program Core Monitoring and Special Studies Regulatory NPS Control Basin Plan Objectives Waterbody Assessments and 303(d) listing NPDES Permit Limits
What Happens to It After That? Technical Team Viewpoint . Employed as a part of a revised monitoring program for SF Bay Tested for a few years to see how well it jives with best professional judgment and optimize integration with monitoring and modeling Decision by Water Board whether to explicitly incorporate into regulatory policy, and/or use to establish nutrient limits in permits
Stakeholder Input on Process Discuss existing approaches and proposed analysis of existing data with technical experts (November 2013) Webinar for stakeholders (January 2014) Expert workshops, proto-monitoring program (February April 2014) Webinar or meeting with stakeholders (early March April 2013) Expert workshops, draft assessment framework (June 2014) Meeting with stakeholders (July 2014) Written draft of assessment framework (July 2014) Meeting with stakeholders (September 2014)